Category: Articles
Effects Of Live Sand & Mud On The Microbial Communities In My Tanks
This little experiment I conducted on my personal tanks at home is described in a post on Reef2Reef. To avoid duplication of content, and because the discussion that follows is likely to be at least as useful as the post itself, I direct the reader there:
Effects Of Live Sand & Mud On The Microbial Communities In My Tanks
© Aquabiomics LLC, 2019 | About us | Contact us | FAQ
The Microbial Community in a Professional Coral Aquaculture System
This article was published on Reef2Reef. To avoid duplication of content, and because the discussion that follows is likely to be at least as useful as the article itself, I direct the reader there:
The Microbial Community in a Professional Coral Aquaculture System
© Aquabiomics LLC, 2019 | About us | Contact us | FAQ
Establishing a Healthy Microbiome in a New Aquarium Using Live Rock
About this article
I originally published this article on the Reef2Reef forum. It’s still available there along with some lively discussion: Establishing a Healthy Microbiome in a New Aquarium Using Live Rock
This article describes an experiment documenting the effects of live rock in a newly established aquarium. While I’ve tried to tell the story as briefly as I can, it’s the story of a month-long study of replicated tanks, with analysis of both water chemistry and the microbial communities in these tanks. The reader should be forewarned: I wasn’t able to distill the whole study into a quick soundbite.
Overall, I found that high-quality live rock promotes the rapid establishment of an effective biological filter and a microbial community similar to those found in mature reef tanks. Dry rock, on its own, showed no evidence of developing such a community during the first month. Interestingly, the benefits and microbial communities of live rock varied widely depending on the source.
Live rock and dry rock in new aquariums
Of all subjects in aquarium husbandry, the topic of how to best establish the microbial community in a new aquarium is one of the most debated. There is general agreement about the need to establish an effective biological filter with nitrifying microbes that convert ammonia and nitrite into the less toxic nitrate. Many aquarists also consider a diverse microbial community to be beneficial for other reasons, including disease prevention and control of unwanted algae or cyanobacteria. However, there are competing schools of thought about the best way to establish these communities.
For decades many aquarists have advocated the use of “live rock” to introduce beneficial microbes in a new aquarium. This term describes rock containing living populations of microbes from a saltwater environment, and includes a wide variety of material, including quarried rock, manmade rock, or pieces of coral rubble.
In contrast, many aquarists prefer to use “dry rock”. This term describes a similar range of materials, except in this case without a living microbial community. Advocates of this approach aim to prevent introduction of unwanted “hitchhikers”, the animals or algae that can accompany live rock.
Another approach that has grown in popularity in the recent decade is the use of products containing cultured bacteria. I have conducted experiments on this subject too and will describe those in a future report, but here I will focus on the effects of live rock itself.
An experiment to directly test the effects of live rock on the aquarium microbiome
Previous studies and the collective experience of the hobbyist community have shown that live rock is an effective tool for establishing a biological filter with nitrifying activity (i.e., the ability to convert ammonia into nitrite then nitrate).
However, we actually know very little about the effects of live rock on the microbial communities in new aquariums. To measure these effects, I set up a controlled and replicated experiment comparing the microbiomes of new aquariums established using live or dry rock.
For this experiment, I set up 6 identical systems using 20-gallon aquariums. Each of these experimental tanks is fully independent with its own heater, skimmer, powerhead, and return pump. They’re built as “all in one” systems; water drains from the display, then down through the rock chamber, then up through the pump chamber and back to the display (Figure 1). The display chambers are lit with black box LEDs, and tanks are covered with glass lids to minimize cross contamination, with a small hole remaining open for gas exchange.
Figure 1: Self-contained nano tanks built for these experiments. (a) Diagram showing water flow through the tanks.
(b) A single tank shown during initial tests. (c) Eight experimental tanks arrayed in pairs on shelving units.
I established biological filtration in each of these tanks using one of three different materials:
Dry rock – dry, washed and sterilized Pukani rock
Live rock a – imported maricultured manmade rock
Live rock b – imported natural rock (coral rubble)
Figure 2: Images of the live rock used in this experiment. (a) was sourced from a retailer, who described it as manmade rock cultured in Fiji. (b) was sourced from a wholesaler who described it as nano branch rock from mariculture facilities in Tonga.
I set up two identical tanks with each type of rock, and arranged these randomly on each shelving unit. I filled each tank with sterile-filtered (0.2 µm) UV-sterilized artificial seawater (NeoMarine – Brightwell Aquatics) prepared at 35 ppt using RODI water. In addition to the rocks, I added 4 lbs of dry aragonite sand to each tank.
Throughout the process, I was careful to control the microbial community introduced into each tank. For this reason, I sterilized tanks, equipment, sand, and dry rocks (but of course not live rock!) using bleach or hydrogen peroxide. While setting up, maintaining, and sampling these tanks, I sterilized my hands with bleach to minimize cross-contamination.
To fuel the growth of nitrifying microbes, I added ammonium sulfate to each tank to achieve a final ammonia concentration of 1 ppm. I measured ammonia every 1-3 days, and dosed as needed to restore each tank to 1 ppm. For the next month I continued to measure water chemistry and sample for microbiome testing, leaving the lights off to avoid algal growth during this period.
I measured water chemistry (ammonia, nitrate, and nitrite levels) using Red Sea and Seachem kits respectively. To correct for the interference of nitrite with the nitrate assay, I first measured nitrite then subtracted it from the nitrate values. Rather than visually evaluating the results (which can be imprecise and subjective), I read the absorbance of these tests at the appropriate wavelengths in a visible-wavelengths spectrophotometer (Model 721, an educational-grade instrument), and calculated concentrations based on comparisons to standard curves prepared using chemical standards made using reagent grade chemicals and an analytical balance.
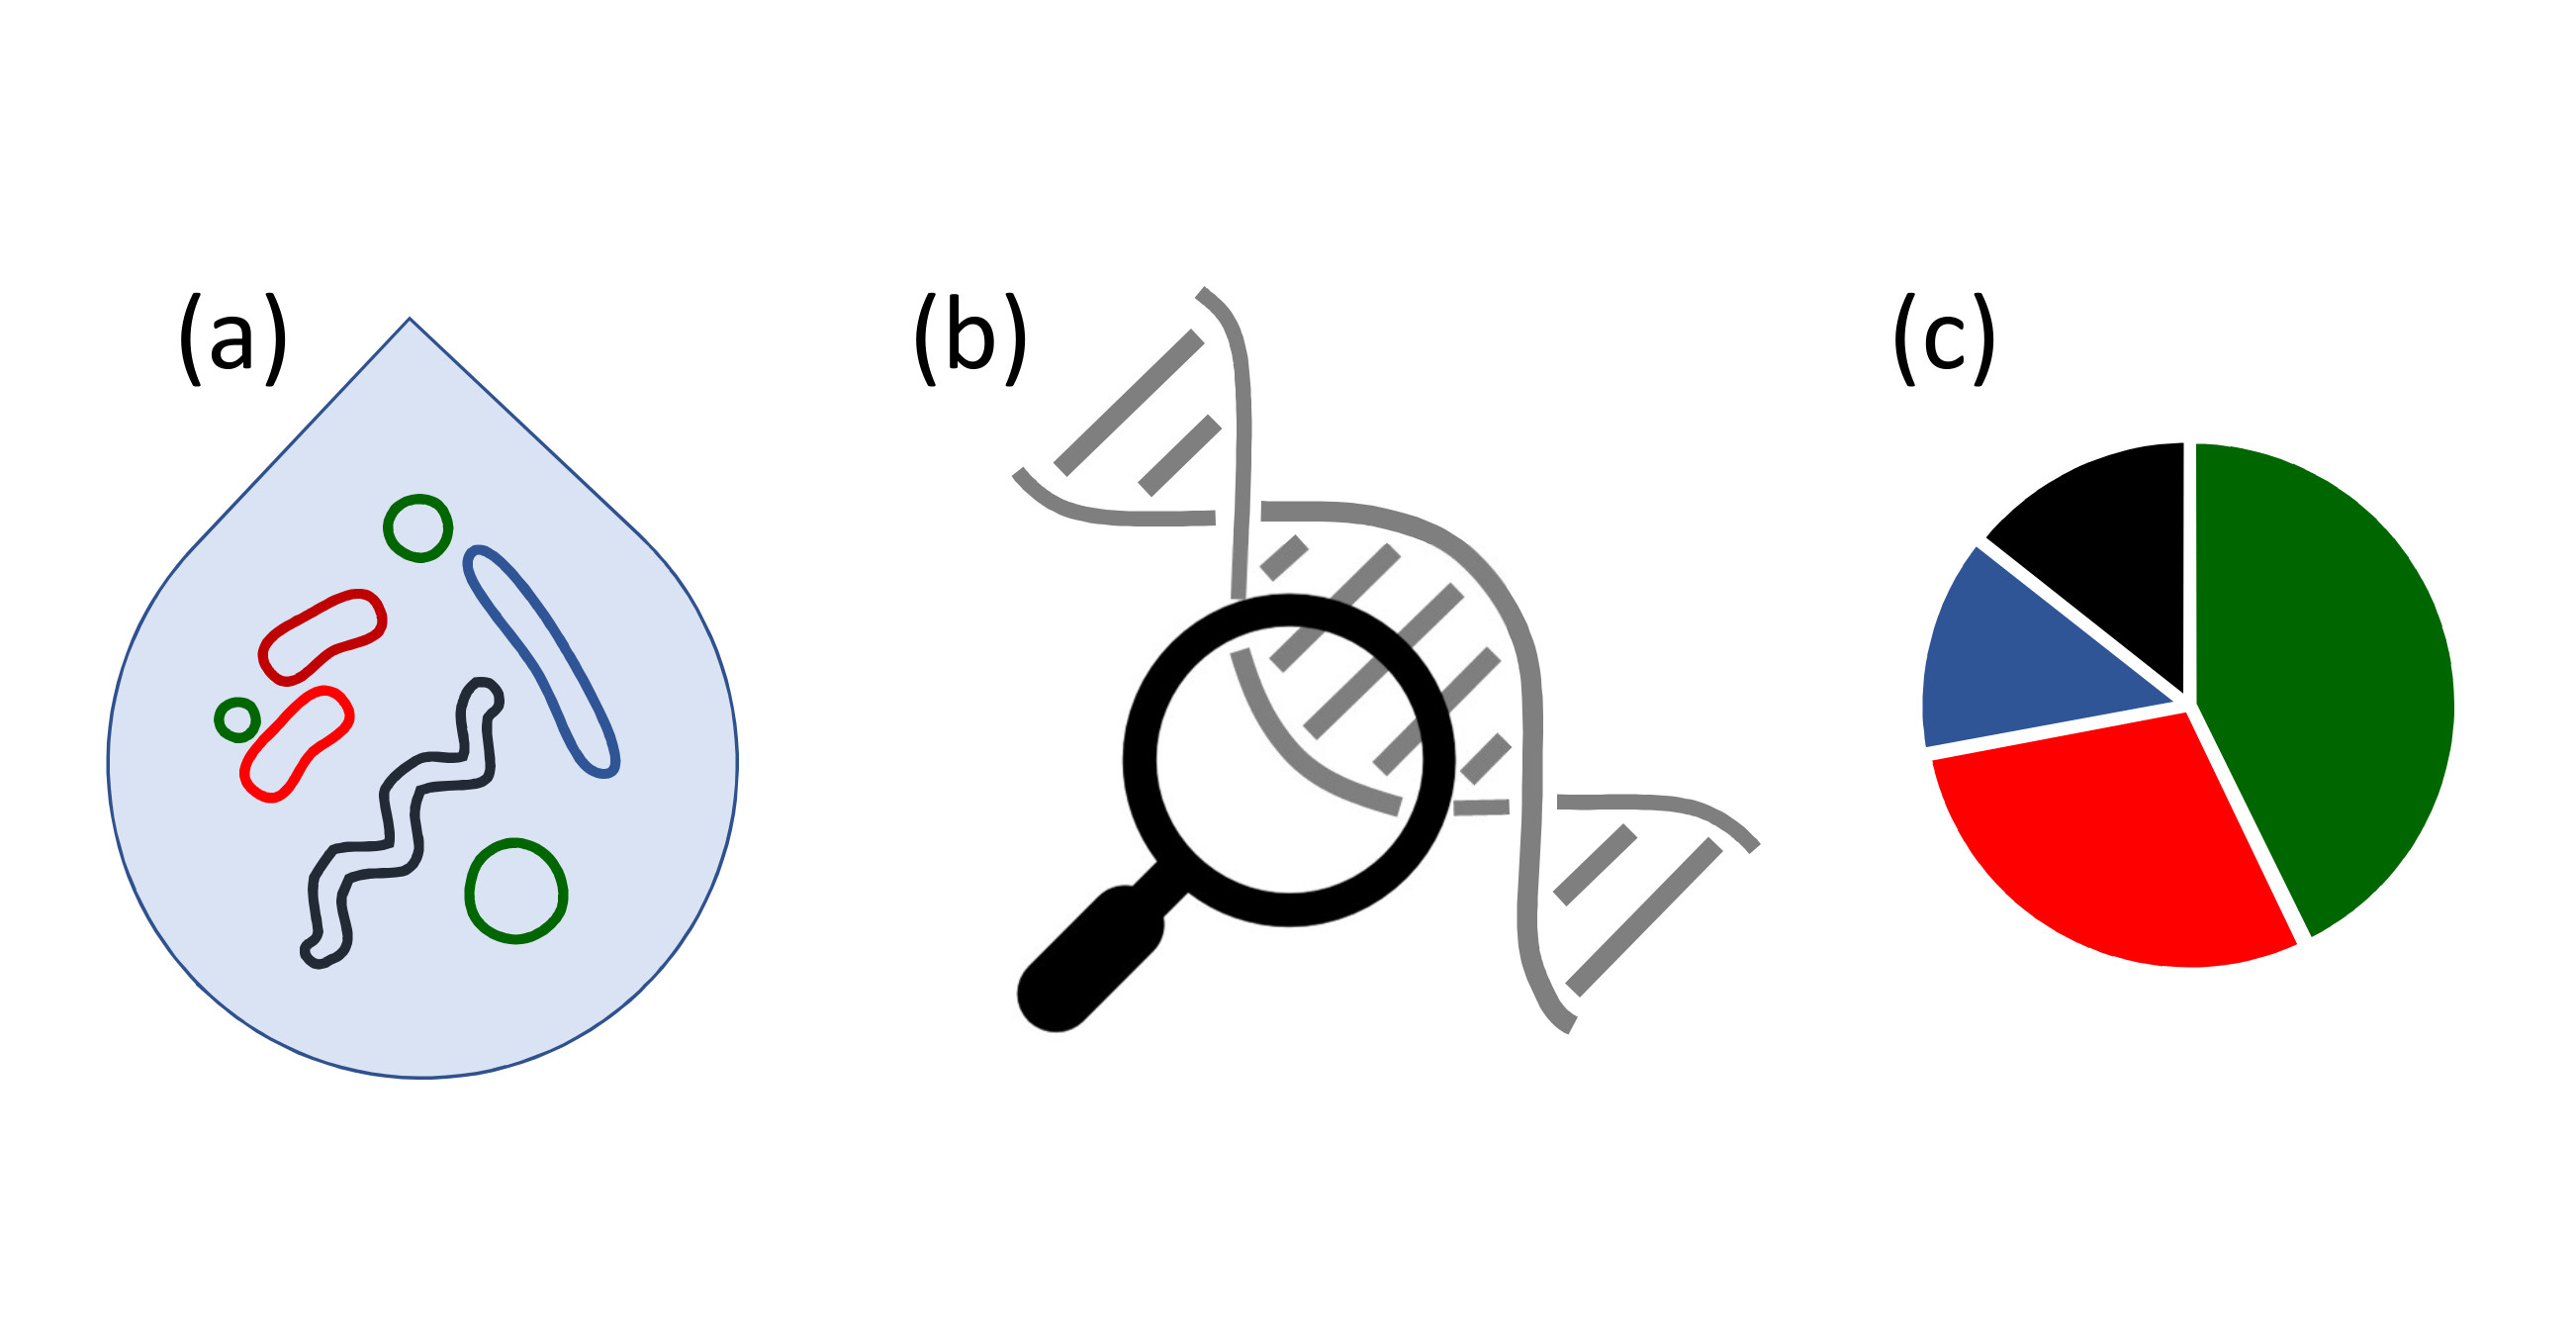
To measure the microbial community in each tank, I followed the same procedures as in previous reports (here and here). Briefly: I sampled water from each tank at the beginning of the experiment, and again after 1, 2, and 3 weeks. I extracted DNA from each sample, and prepared these samples for DNA sequencing, focusing on a genetic marker called 16S commonly used to study microbial communities. I sequenced about 10,000 reads from each sample, and compared these with public databases (GreenGenes) to identify, classify, and measure the relative abundance of all microbes in these samples.
Live rock produces more diverse microbial communities than dry rock
These experiments showed that the choice of live or dry rock has profound and lasting effects on the microbial community. Communities in live rock tanks were much more diverse than dry rock tanks.
The diversity of a microbial community can be described simply in terms of the number of unique microbial types it contains. I found that unsurprisingly, tanks established using live rock contained much more diverse communities than those established with dry rock. This diversity advantage was already apparent shortly after establishing the tanks, and continued to increase throughout the experiment (Figure 3).
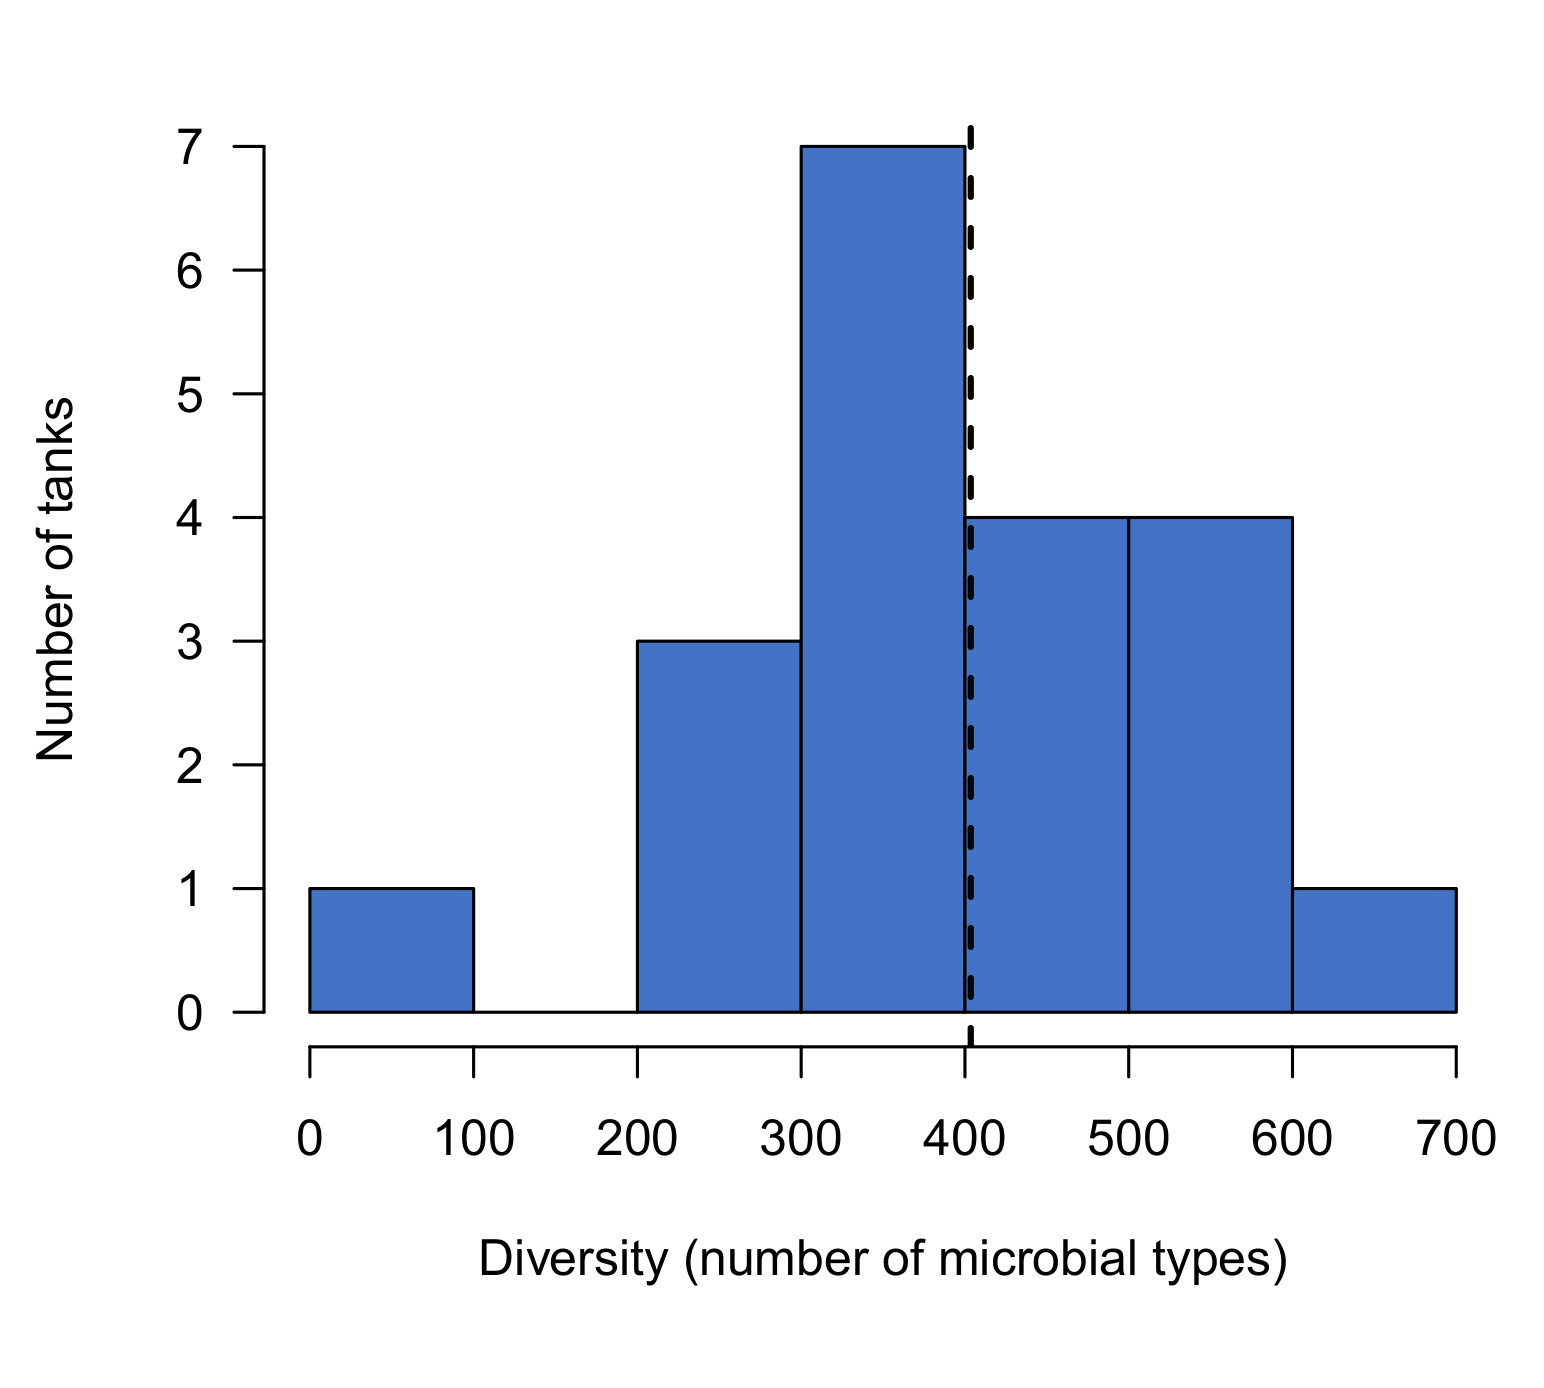
Figure 3: Diversity of microbial communities in aquariums started with dry rock or live rock from different sources. Dashed lines indicate the 10th and 50th percentiles of diversity scores in a previous survey of established reef tanks.
Within the first 2 days after establishing these aquariums, live rock tanks already showed slightly greater diversity than dry rock (16-28% higher). Diversity in live rock tanks increased over the first two to three weeks, then remained relatively stable for the remainder of the experiment. The final diversity in live rock tanks was comparable to established reef tanks (average = 400 types). In fact, 20% of the established reef tanks we sampled recently (read more here) had lower diversity than the average in live rock tanks at the end of our experiment (325 types).
In contrast, the diversity in dry rock tanks was already slightly lower than live rock tanks, and it remained low throughout the experiment. At the end of the experiment, dry rock tanks were no more diverse than at the beginning: less than half that of live rock tanks, and only one third of that in established aquariums (Figure 3).
Live rock communities are like established aquariums, but dry rock communities are different
The composition and abundance of live rock communities was also more similar to established tanks than the communities in dry rock tanks. In a previous report, I described the ‘core aquarium microbiome’, a group of microbial families present in nearly all the established reef tanks I’ve sampled. Here, I compared the microbiome of live rock and dry rock tanks with this core microbiome to evaluate which approach was more effective in promoting microbial communities like those in established reef tanks.
In tanks started with live rock b, these core microbial families were generally present at levels similar to those in established aquariums. Dry rock tanks, in contrast, showed striking differences in the levels of these core microbial families. Dry rock tanks were deficient in some families, and enriched in other families when compared with established reef tanks.
Figure 4: Examples of differences in the levels of core microbial families between tanks started with live rock or dry rock. Each panel shows the average abundance of each family. Typical levels are from a previous survey of 20 established reef tanks, and levels for dry or live rock represent the average of duplicate tanks.
Examples of these differences are shown in Figure 4. One of two most abundant families in the core microbiome (Flavobacteriaceae) was also present at similarly high levels in live rock b communities, while dry rock communities were deficient in this family. Dry rock tanks showed similar deficiencies in Saprospiraceae and Cenarchaeaceae, while these families were present in live rock b tanks at levels similar to an established aquarium.
Other families were present in dry rock tanks at excessively high levels compared with established reef tanks. Hyphomicrobiaceae, Flammeovirgaceae, and Oceanospirillaceae are all found in established reef tanks, but these families were found at much higher levels in experimental tanks started with dry rock.
These family-by-family comparisons illustrate the differences between dry rock tanks and established reef tanks. To summarize these similarities and differences across all 19 of the core microbial families, I compared their relative levels in each sample with their average levels in the typical reef tank. I summarized these comparisons in a term I’m calling the “balance score”. (For readers familiar with statistics, this is simply the determination coefficient R2 calculated from a linear regression.) These scores range from 0 to 1, where 1 indicates a balanced community where the core microbial families are present at the same relative levels as in the average reef tank.
Figure 5: Microbial communities in tanks started with live rock b are more similar to typical reef tanks than those in tanks started with dry rock or live rock a. Each bar shows the average score of duplicate identical tanks. Dashed lines indicate the 10th and 50th percentiles of balance scores observed a previous survey of established reef tanks.
Comparing these scores reveals that communities in live rock tanks were more balanced (i.e., more similar to mature reef tanks) than dry rock tanks. Balance scores in dry rock tanks were initially very low, and remained low throughout the experiment (Figure 5). In contrast, tanks started with live rock b showed high balance scores initially and throughout the experiment.
Comparing these scores with those obtained from established reef tanks provides important context for interpreting these differences. Live rock b communities had scores very similar to established reef tanks; in fact, the scores of these tanks exceeded those of nearly 50% of established reef tanks in our recent survey. In contrast, the scores of dry rock tanks were lower than >90% of reef tanks we sampled.
Together, these comparisons demonstrate that the microbial communities established using high-quality live rock are much more similar to an established reef tank than are communities established using dry rock.
Nutrient-processing microbes are much more abundant in aquariums started with live rock
Measuring the levels of specific microbes with known nitrifying activities revealed that these were present at much higher levels in experimental tanks started with high-quality live rock.
In the marine environment, ammonia is processed by ammonia-oxidizing Bacteria (AOB) including Nitrosococcus and several members of the Nitrosomonadaceae, and ammonia-oxidizing Archaea (AOA) in the family Cenarchaeaceae. AOA and AOB were present at low levels in all tanks throughout the experiment, but their abundance increased rapidly in live rock b (Figure 6a). By the end of the experiment, the total abundance of these groups was more than 14-times higher in tanks started with live rock b than in dry rock tanks. In fact, only 3 weeks after starting these tanks, the relative levels of AOB and AOB in these tanks were already higher than half of the established reef tanks we sampled. Dry rock tanks, in contrast, remained below the 10th percentile for these groups’ levels throughout the experiment.
Figure 6: Relative levels of specific groups of microbes with nitrifying activity. Dashed lines indicate the median (50th percentile) level in a recent survey of established reef tanks. (a) Ammonia-oxidizing Bacteria and Archaea. (b) Nitrite-oxidizing Bacteria, NOB. Orange and green lines overlap in (b) because NOB were not detected in these water samples.
Nitrite is processed by nitrite oxidizing Bacteria (NOB) including Nitrobacter, Nitrococcus, and members of the families Nitrospinaceae, Nitrospiraceae, and Gallionellaceae. NOB were generally present at much lower levels overall than AOA and AOB; this can be best estimated at the end of the experiment in tanks started with live rock, where NOB were 18-times less abundant AOA+AOB. NOB were undetectable in all tanks at the beginning of the experiment, but these levels rose quickly in live rock b and became detectable within 3 weeks (Figure 6b). At that time, the relative levels of NOB in live rock b were already higher than half of the established reef tanks we sampled. In contrast, NOB remained undetectable in dry rock tanks throughout the experiment.
Interestingly, the growth of NOB in tanks started with live rock b perfectly mirrors the growth of the more abundant AOA & AOB (Figure 6a). This suggests that the populations of these groups develop simultaneously, so that levels of the more abundant AOA & AOB group may be sufficient for evaluating the maturity of a biofilter even if the less abundant NOB are not detected.
An important caveat for these findings is that these nutrient-processing microbes are primarily found in biofilms rather than free-living in the water column. The presence of these groups in aquarium water results from the recirculation of this water over biofilm-covered surfaces (e.g. pipes), and is evidence that they are present in the aquarium. However, their absence from some samples should not be interpreted as proof of absence in those tanks, since these groups are inherently less abundant in water samples than the biofilm. Instead, we can only say that microbes from these groups were below the limit of detection for this test (approximately 1 copy per 10,000, in this case), and were not detected.
Live rock is not all the same; the microbiome (and benefits) depend on the source
A careful reader may have noticed by now that the two sources of live rock used in this experiment produced very different communities. Although both sources promoted the growth of diverse microbial communities (comparable to the levels found in established reef tanks; Figure 3), the composition of these communities was very different.
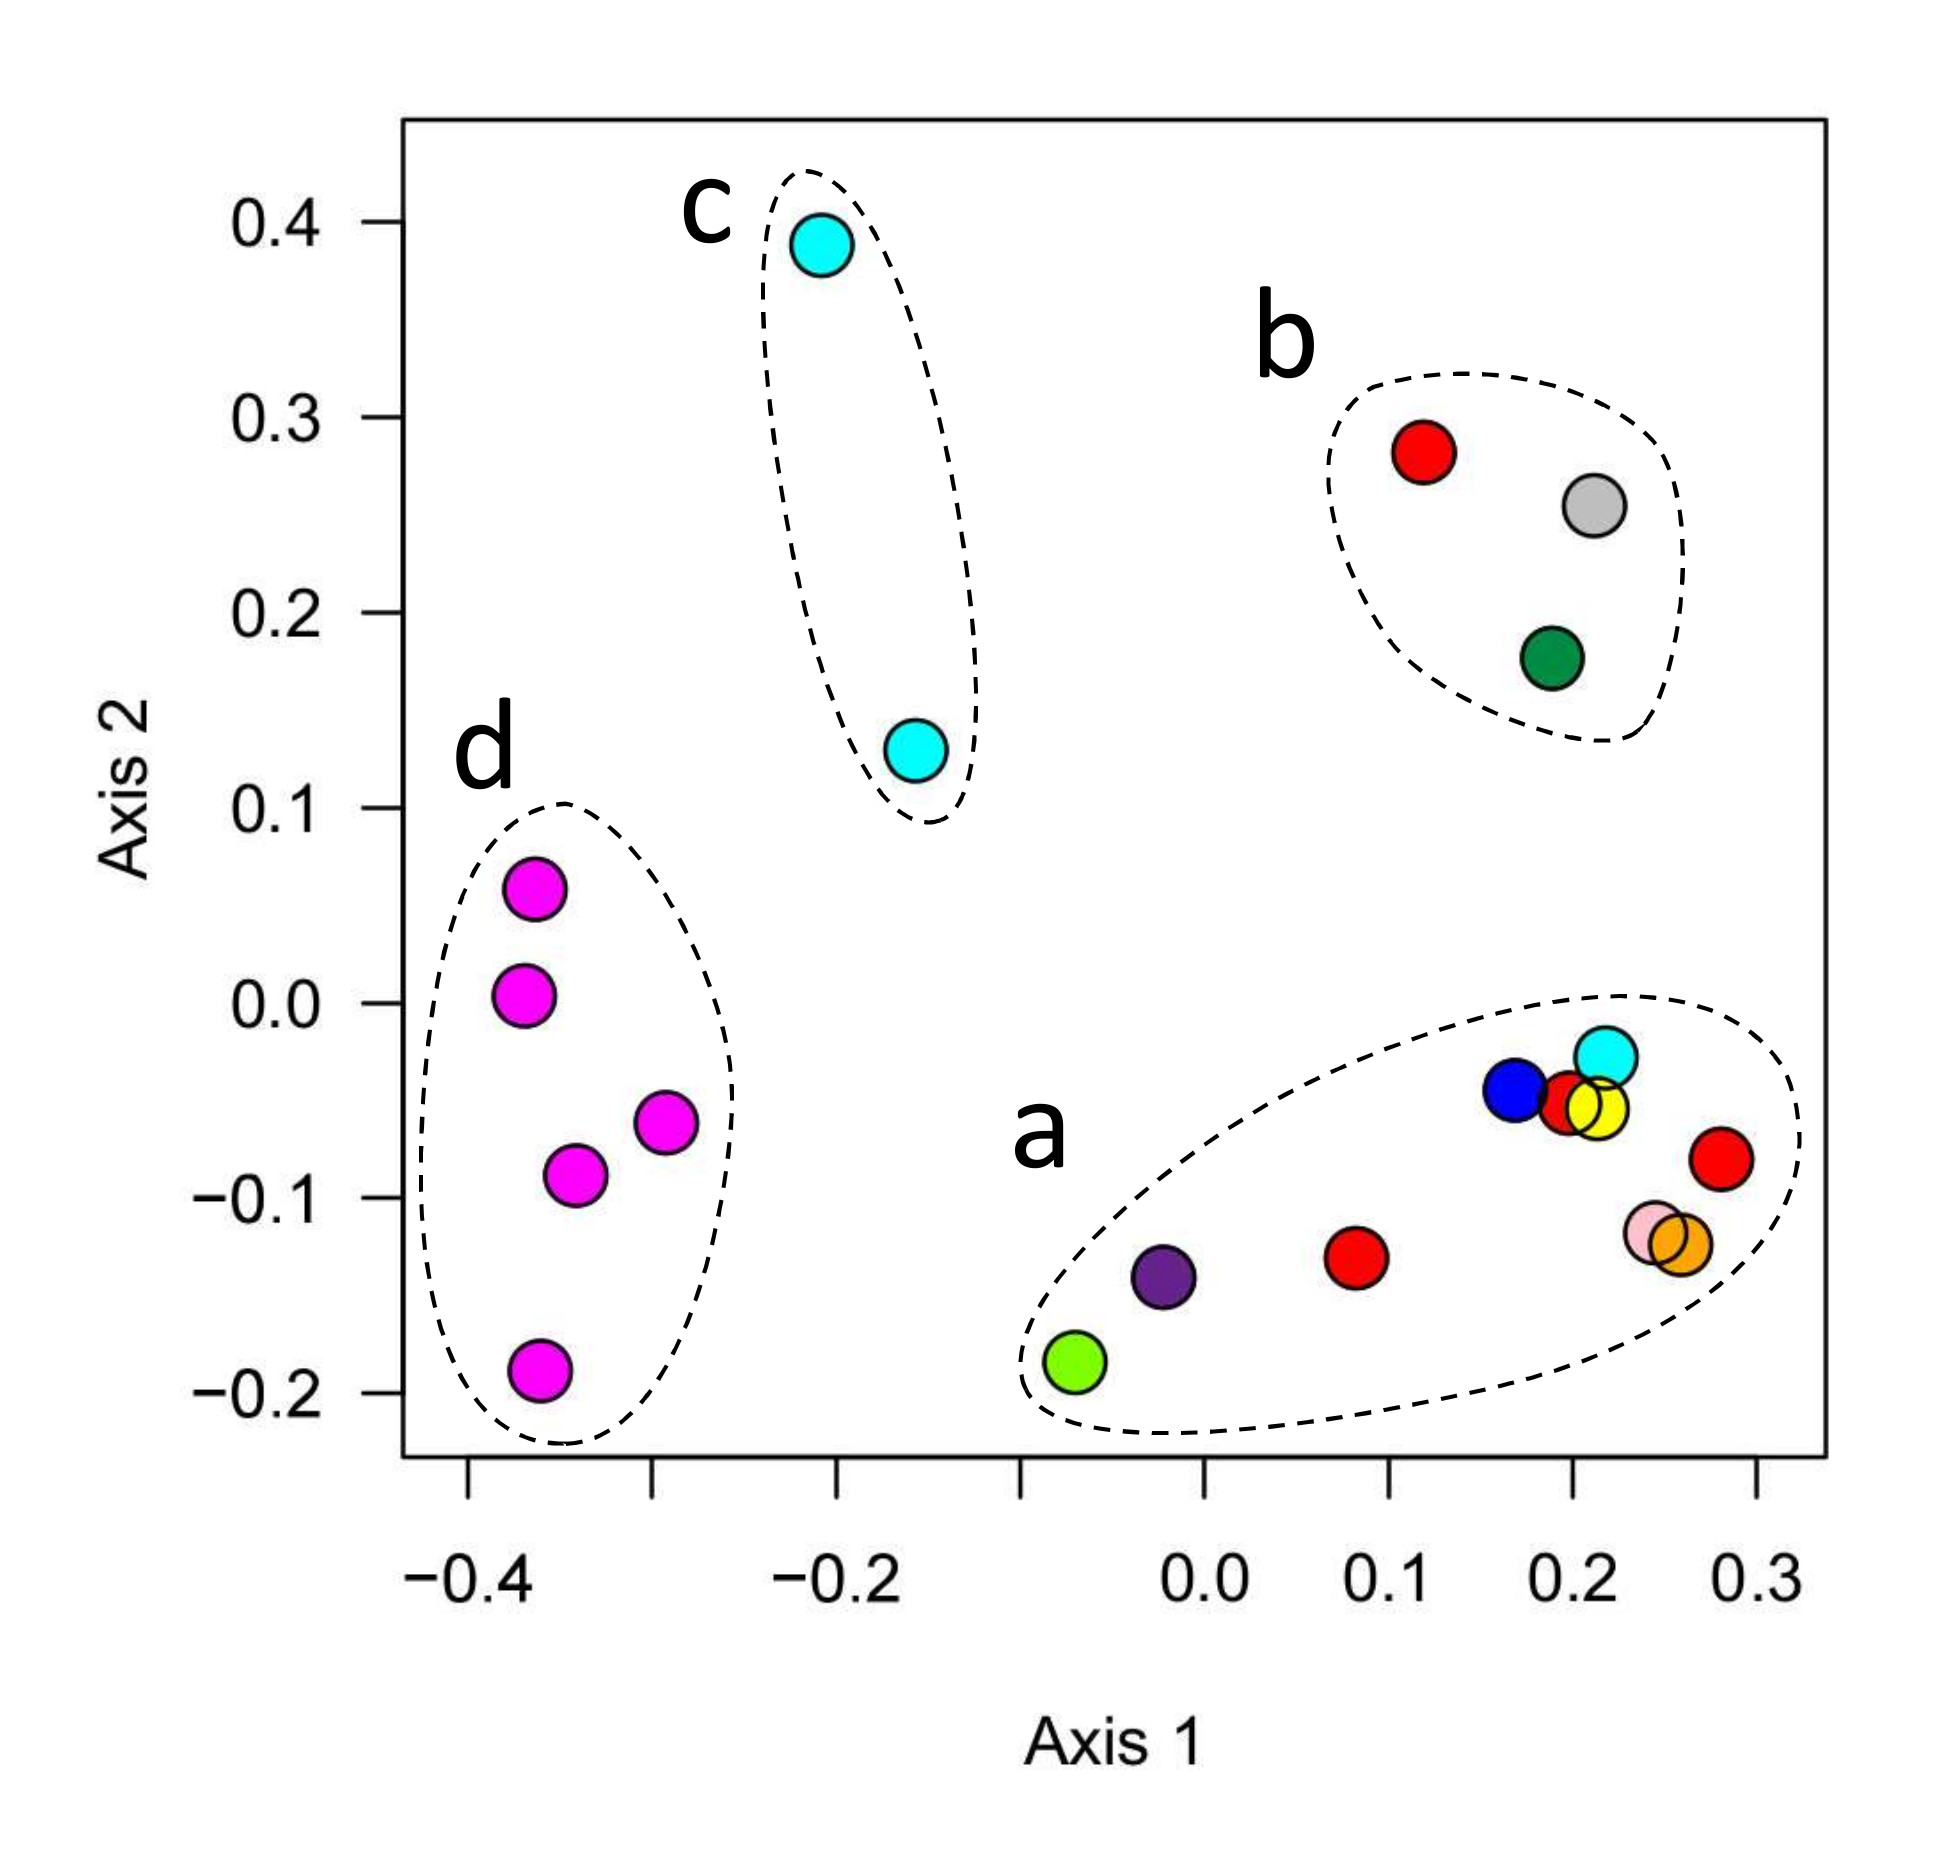
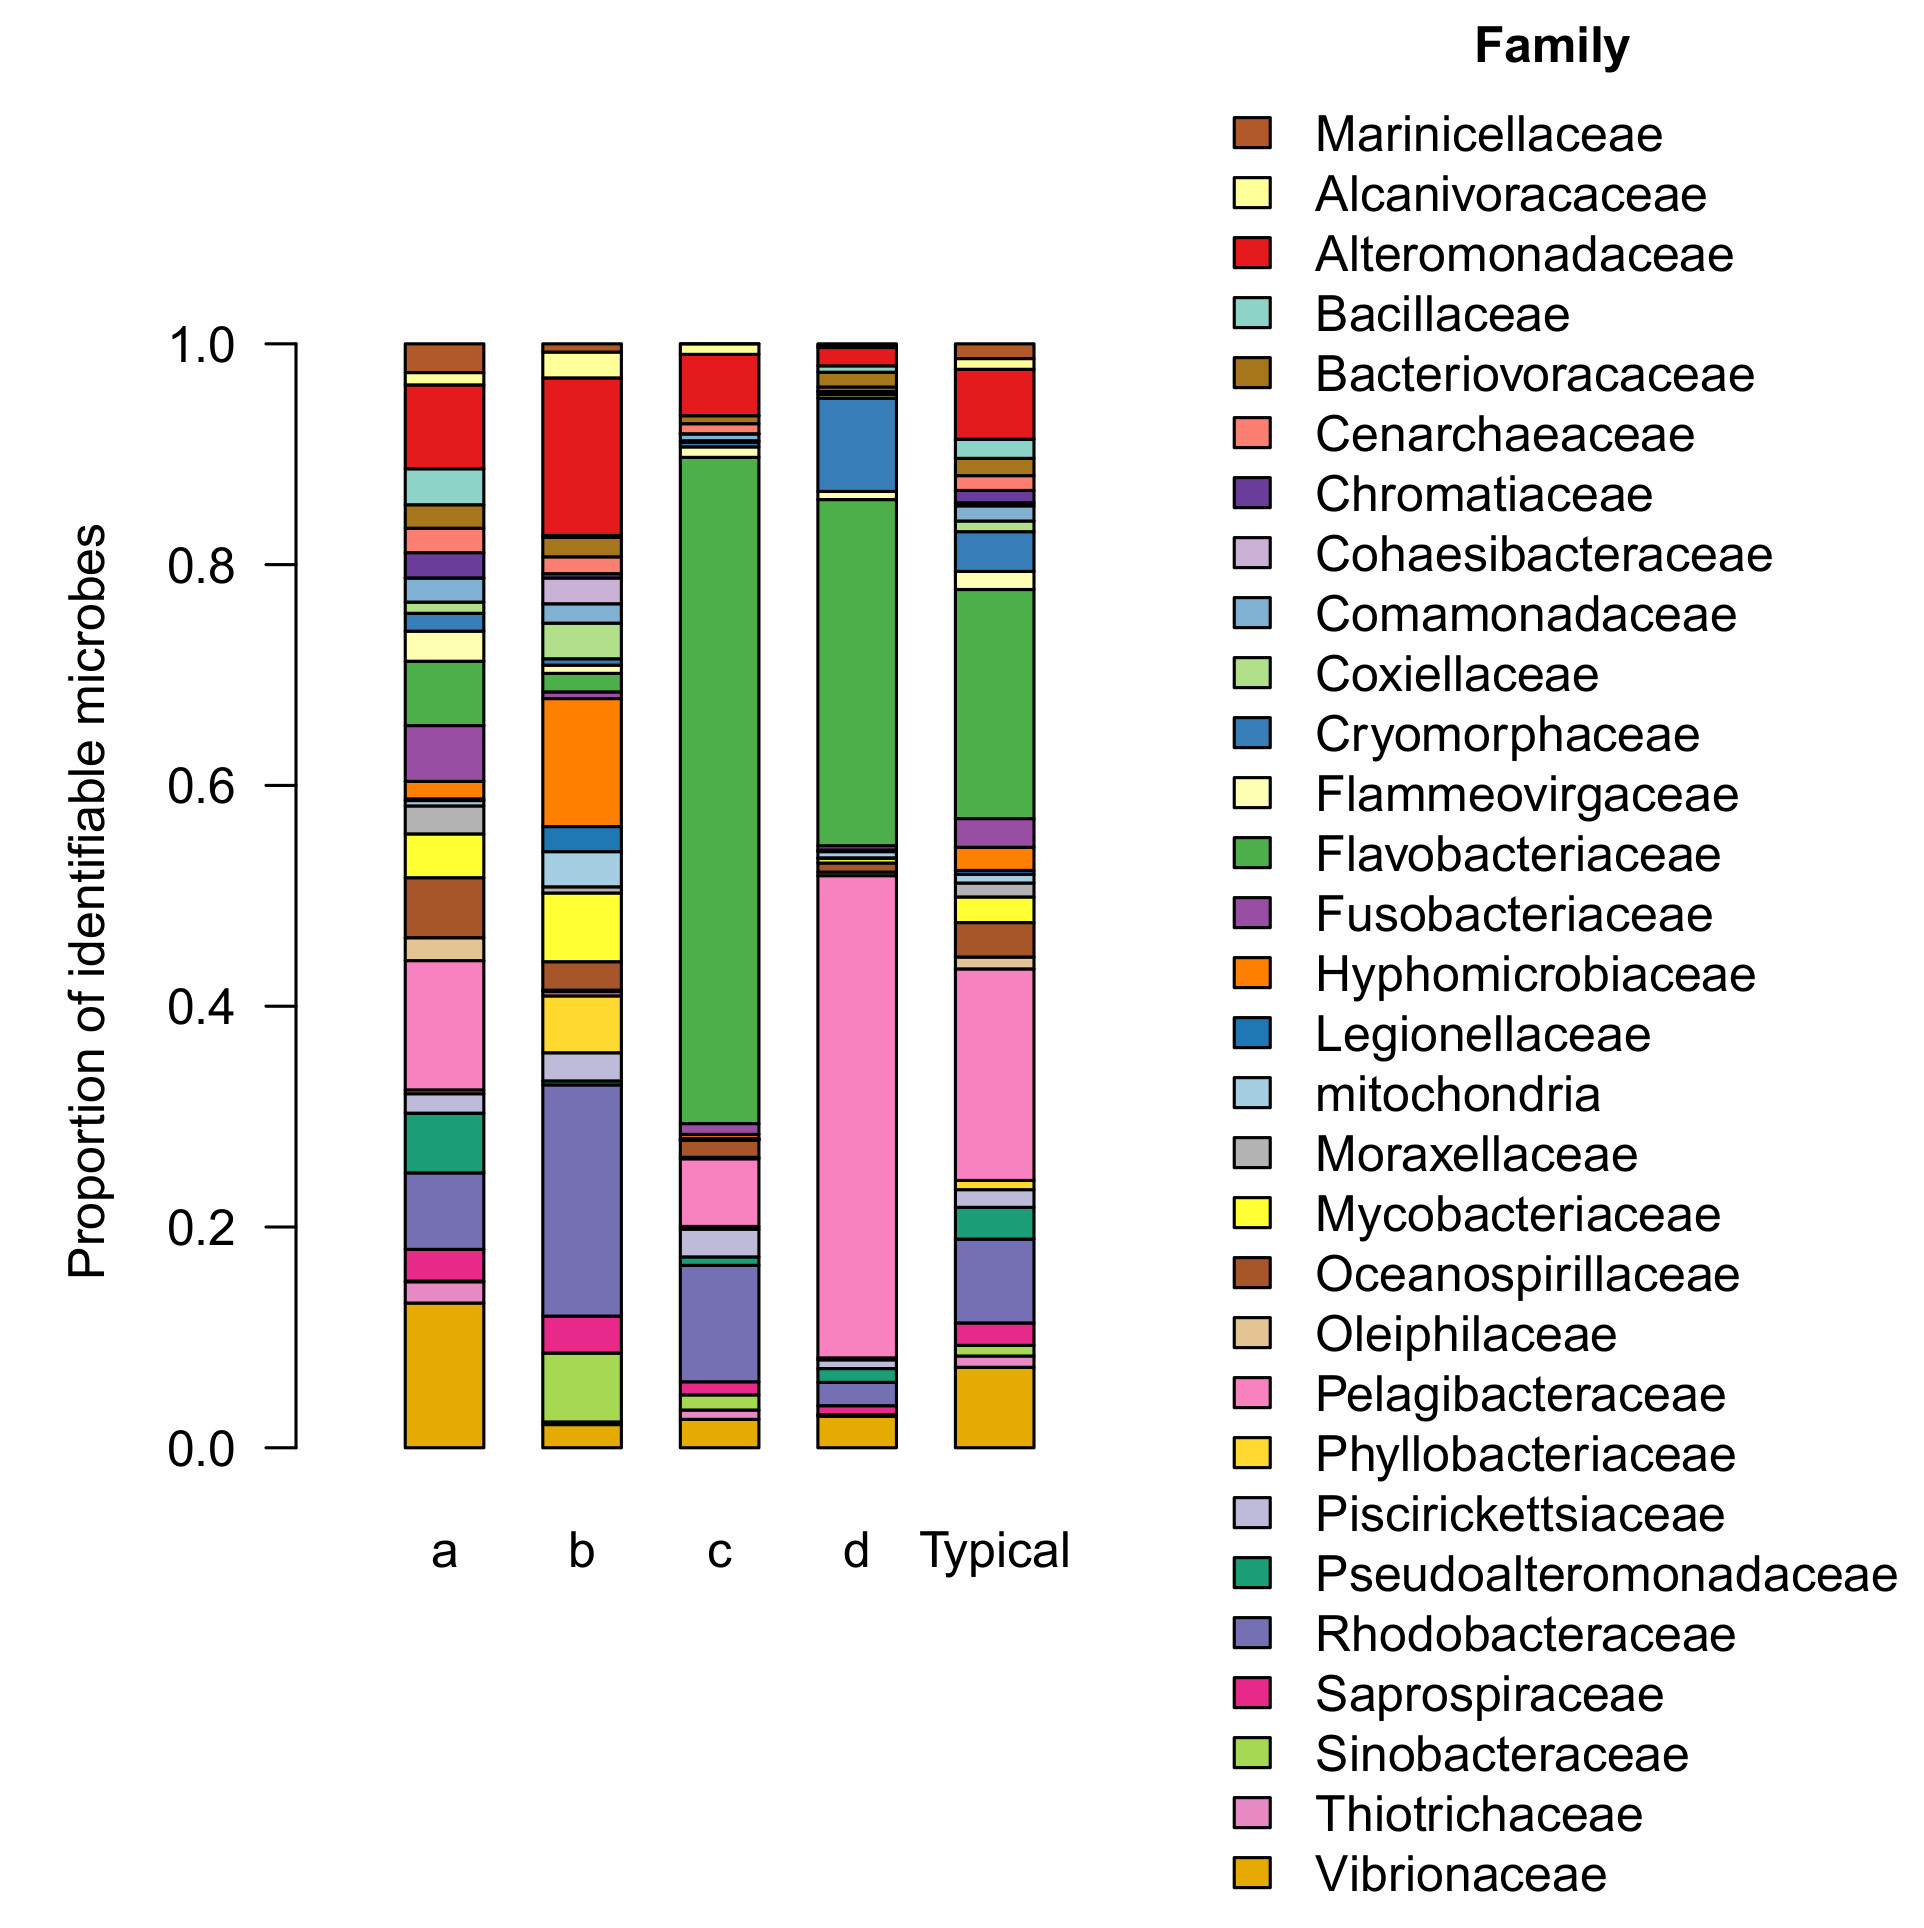
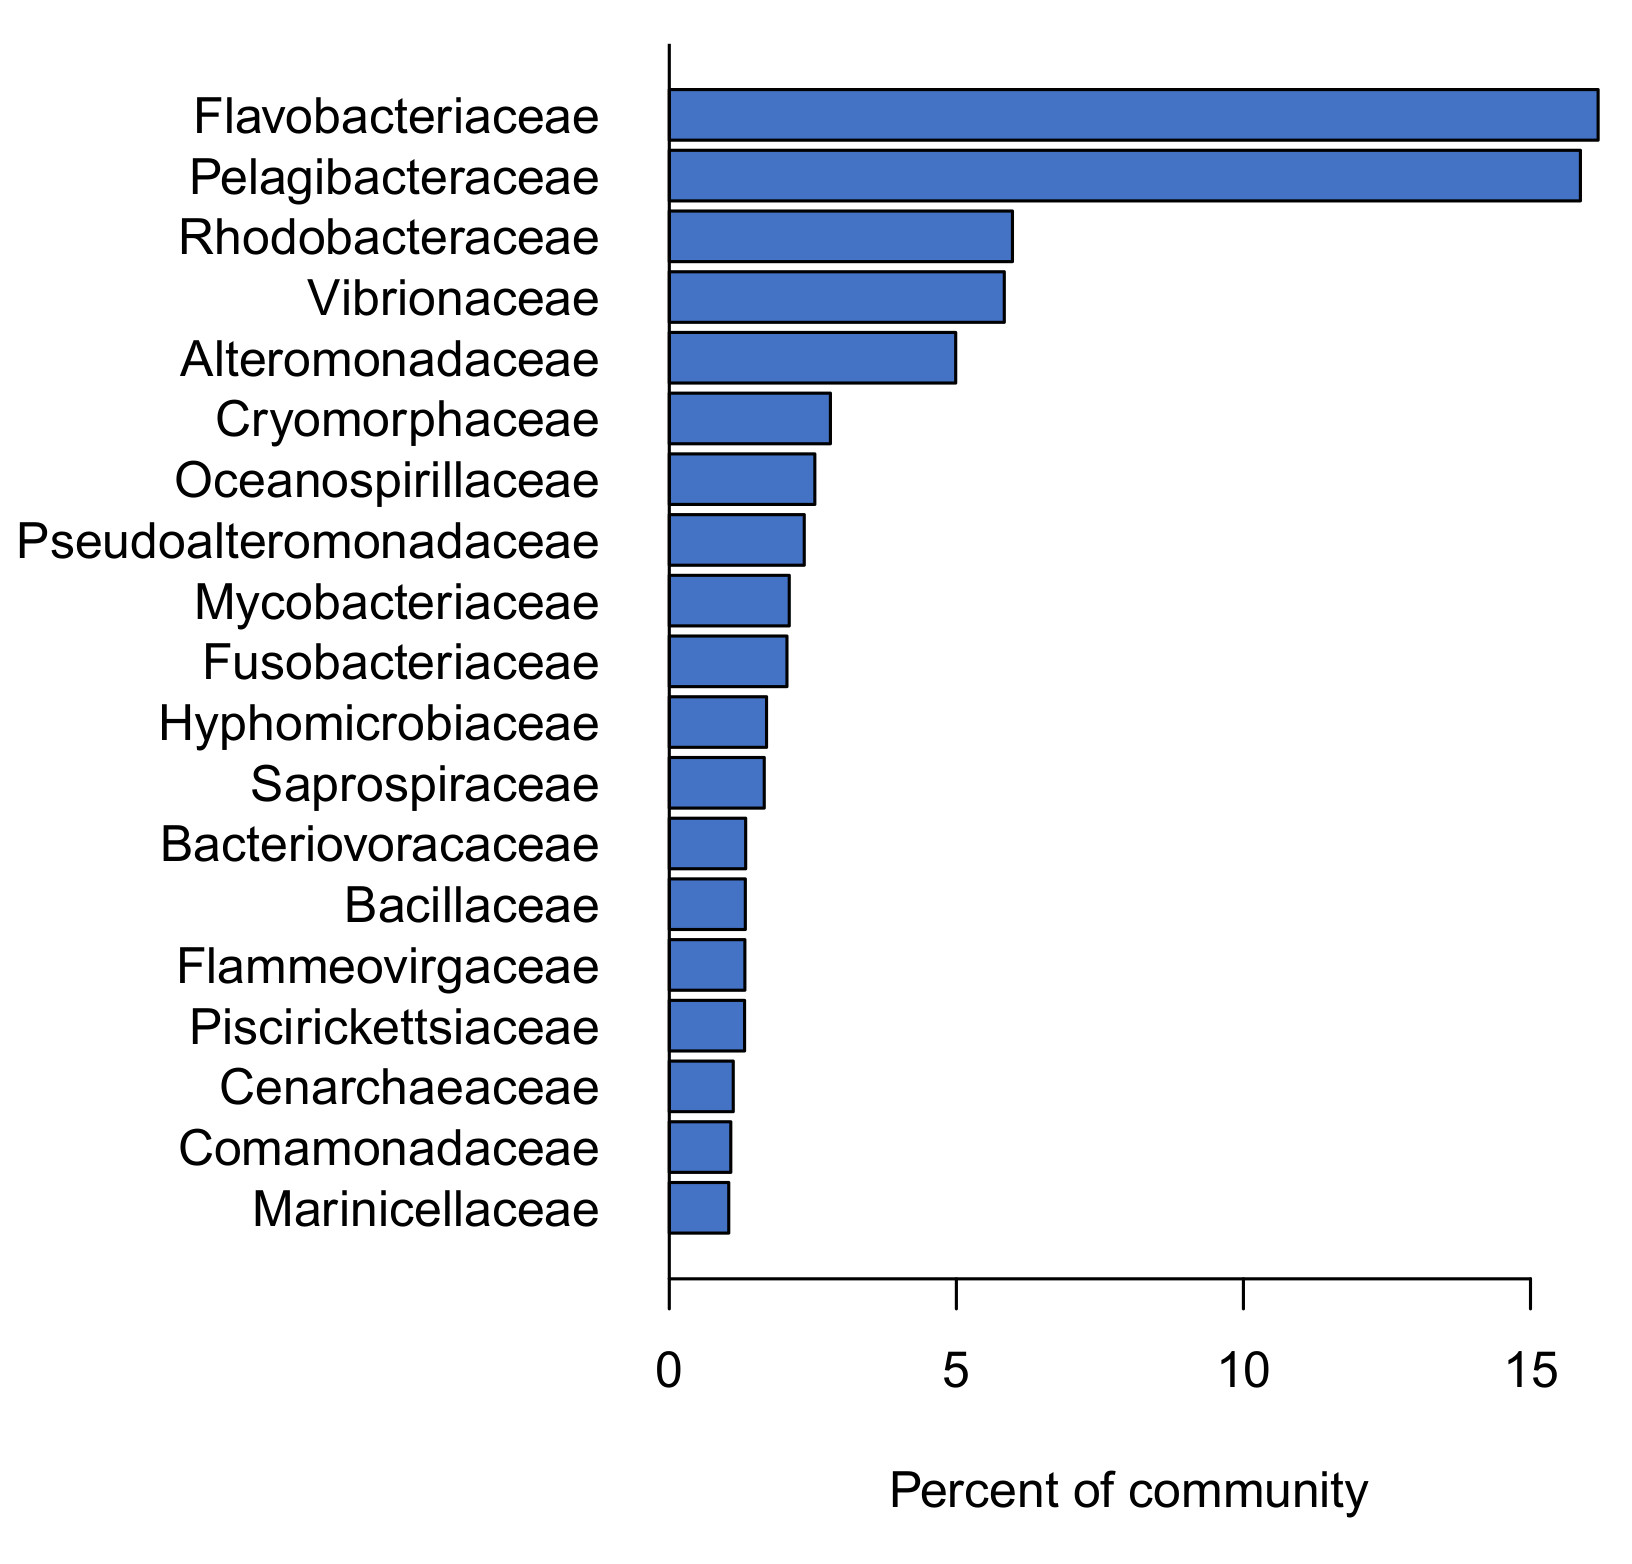
Figure 7: Differences in the composition of microbial communities in tanks started with dry rock or live rock. All families making up at least 1% of the community in any group are shown. Each bar represents the average of duplicate tanks.
These differences are clear when you compare the dominant families in each community (Figure 7). The community in experimental tanks started with live rock a was dominated by Flavobacteriaceae, which is also one of the top two most abundant families in the microbiome of a typical reef tank. The community in live rock b, in contrast, was dominated by Alcanivoraceae, which is not a major component of the typical reef tank’s microbiome (0.4%).
These communities were also different in their overall composition (Figure 7). The microbial families Criblamydiaceae, Parachlamydiaceae, and Kordiimonadaceae were abundant in live rock a but not in live rock b or in typical reef tanks. In contrast, the families Cenarchaeaceae and Flavobacteriaceae were abundant in both live rock b and typical reef tanks, but not in live rock a.
These differences in composition are also clear from the difference in balance scores (Figure 5). The low scores of live rock a indicate that the relative levels of the core microbial families were very different in these tanks than in typical reef tanks. In fact, these scores were comparable to dry rock tanks (Figure 5), despite the difference in composition and diversity of these communities (Figures 3, 7). This highlights the fact that while there is a single consensus microbiome shared by many reef tanks (read more details here), there are many different ways to deviate from this consensus. It also emphasizes that measurements of diversity alone are inadequate for describing the quality of an aquarium’s microbiome.
Overall this comparison between live rock sources a and b showed that these materials produced very different communities that were both more diverse than dry rock, but differed in their composition, balance, and levels of nitrifying microbes.
Live rock rapidly establishes an effective biological filter; dry rock does not
To evaluate the development of a biological filter in these tanks, I measured changes in ammonia, nitrite, and nitrate concentrations in all tanks throughout the experiment. These measurements clearly showed that live rock promoted the rapid development of nitrifying microbial communities, while dry rock tanks showed little or no evidence of nitrification activity throughout the experiment.
I maintained ammonia at approximately 1 ppm in each tank throughout the experiment to fuel the growth of these communities. To measure how quickly ammonia was consumed in each tank, I took a series of measurements after adding each dose of ammonia. Figure 8 show the ammonia consumption in 3- to 4-week old tanks, from the final week of the experiment. Microbes in live rock tanks consumed 100% of ammonia (reducing levels to zero) in less than 2 days, while dry rock tanks showed no change in ammonia during this period and in fact only consumed 7% of ammonia over the 6-day series of measurements (Figure 8).
Figure 8. A series of measurements during the final week of the experiment, showing consumption of ammonia. Each symbol represents the average of duplicate tanks.
The growth of ammonia-oxidizing microbes can also be demonstrated by measuring the appearance of nitrite in aquarium water. Nitrite was detected within 18 days in live rock tanks (0.5 ppm), and levels continued to rise until the third week , then began to decline (Figure 9a). In contrast, nitrite remained undetectable in dry rock tanks throughout the experiment.
Figure 9. Production of nitrite and nitrate by microbial communities in each tank after while ammonia levels were maintained at approximately 1 ppm. Each symbol represents the average of duplicate tanks.
The growth of nitrite-oxidizing microbes can be indirectly measured from the appearance of nitrate in aquarium water. Nitrate was initially undetectable in all tanks, and first appeared in live rock tanks at 12- to 18-days (Figure 9b). Levels continued to rise in live rock tanks until the final week of the experiment. In contrast, nitrate remained undetectable in dry rock tanks throughout the entire month after establishing these tanks.
The differences between live and dry rock in these experiments were clear: live rock produced microbial communities that serve as an effective biological filter, and dry rock did not.
The differences in water chemistry between live rock sources were less obvious, but on closer examination it’s clear that live rock b established a biological filter more rapidly than live rock a. Tanks started with live rock b produced detectable nitrite (0.33 ppm) within 12 days after the first dose of ammonia, while nitrite levels remained negligible (0.06 ppm) in live rock a at this stage. After 6 more days (18 days total), tanks started with live rock a caught up and produced comparable nitrite levels (0.39 ppm).
The same patterns can be seen in accumulation of nitrate. Tanks started with live rock b produced detectable nitrate (3 ppm) within 9 days after the first dose of ammonia, while nitrate levels remained very low (0.4 ppm) in live rock a at this stage. It was 6 days later (day 18) before the tanks started with live rock a produced comparable nitrate levels (3.3 ppm).
Finally, the depletion of nitrite in live rock b by the end of the experiment, while nitrite levels remained fairly constant in live rock a (Figure 9a) is further evidence that live rock b promoted more rapid growth of nitrite-oxidizing microbes than live rock a.
[A reader familiar with the details of these tests may wonder if the similarity in these patterns results from interference of nitrite with the nitrite tests. In fact, to correct for this I subtracted the measured nitrite concentrations from nitrate data, removing at least the majority of this interference.]
Overall, these measurements of water chemistry demonstrate that live rock can establish an effective biological filter much more rapidly than dry rock, which failed to establish an effective biofilter at all within the one-month duration of this experiment.
These experiments also showed that the benefits of live rock differed depending on the source. High-quality live rock (b) developed both ammonia-oxidizing and nitrite-oxidizing activities more rapidly, achieving two of the traditional endpoints for cycling a tank (appearance of nitrate and depletion of nitrite) more quickly than low-quality live rock (a), which never depleted nitrite during the course of this experiment.
Finally, it is interesting to note that nitrifying microbes showed up in the microbiomes of live rock b tanks (Figure 5) at the same time as nitrite and nitrate appeared in their water (Figure 8). Meanwhile, these microbes were present at much lower levels in live rock a. This is consistent with the observation that the larger populations of nitrite-oxidizing microbes in live rock b were able to reduce nitrite levels to zero by the end of the experiment, while nitrite levels remained stable in live rock a.
This comparison also serves to illustrate a point made previously that undetected microbes are not necessarily absent. The chemistry data clearly show that live rock a contained some NOB, even though they were present at low levels below the limit of detection for DNA sequencing of water samples. Direct comparison of water and biofilm samples from a single tank confirmed that these microbes can be absent in the water column but present in biofilm. Based on these and related observations, we’re including both biofilm and water samples in all current and future testing, to increase our ability to detect these important microbial components of the biological filter.
High-quality live rock can also avoid unwanted algal blooms
This section is really a post-script to the original experiment. My original goal was to compare the microbial communities and nutrient processing activities of tanks set up with dry or live rock. After ending the cycling experiment I continued to maintain the tanks with minimal maintenance, adding a small amount of RODI water weekly to replace evaporation. I didn’t even clean the glass. In fact, the inner surface of the glass in these aquariums had never been cleaned in the 3 months since they were set up, at the time these photos were taken.
Two and a half months after starting the tanks, I turned on the lights to allow algal growth. Two weeks later (at 3 months) I added a small number of identical livestock to each tank (snails, hermit crabs, and a single fish – Halichoeres sp., probably melanurus).
At this stage, on observing the maturing tanks more closely, it became clear that in addition to the differences in nitrifying activities described above, the experiment also produced another effect. As the aquariums matured, different algal communities developed in each group, and the tanks started with high-quality live rock almost entirely avoided the ugly stages associated with unwanted algal blooms in new aquariums.
Figure 10. Photographs of the experimental tanks after approximately 3 months. All photos were taken with the same settings and lighting, and glass was never cleaned in any of these aquariums after the initial setup. Letters indicate IDs of the experimental tanks.
The differences are obvious and consistent within each group (Figure 10). The tanks started with either dry rock and live rock a show extensive algal growth on all surfaces, including sand, rocks, and glass. In contrast, tanks started with live rock b appeared dramatically cleaner, with no visible algal growth on sand or rocks and very little on the glass (See Figure 11 for a closer view of each example).
Figure 11. Closeup views of the sand and rock in a tank from each treatment group.
Because these strong effects were seen consistently across duplicate tanks, which were otherwise identical, we can be confident attributing these effects to the source of rock. Based on the striking differences in microbial communities already measured in these tanks during the first month of their development, I conclude that differences in microbial communities contributed to these effects. Further experiments will be needed to identify the specific microbial families responsible for these differences in algal communities, but the overall effects are clear.
Many aquarists have seen differences between the ugly stages in newly established aquariums, but few data from controlled experiments are available to determine the reasons for these differences. My findings demonstrate tanks started with live rock harboring microbial communities like those of established reef tanks (i.e., high balance scores) develop very little of the unwanted algal blooms often seen in new aquariums. This matches an observation made by many experienced reef keepers that tanks started with high-quality live rock can avoid the ugly stages. Together, these findings suggest that microbiome testing can be used to evaluate these communities before the ugly algal blooms ever develop.
High-quality live rock is recommended when starting a new aquarium
Based on these findings, from a microbiological perspective several conclusions are clear:
High-quality live rock promotes the rapid establishment of a microbial community like established reef tanks.
Dry rock does not develop such a community on its own in a similar time frame.
Live rock is not all the same, but differs in both microbial communities and biological filtration.
Live rock quality is not just a question of microbial diversity, but also community composition (not just how many types, but also which types).
The maturity of a biological filter, and the quality of live rock, can be measured through microbiome testing.
None of this addresses other reasons aquarists may favor dry rock or live rock (including aesthetics, ecological impacts, phosphate contents, or unwanted hitchhikers). But many aquarists use live rock specifically because of its microbial community, and this article provides some of the first data on these communities.
I found striking differences in the microbiome and biological filtration of different types of live rock. This naturally leads to the question, how can we identify high-quality live rock? Unfortunately, a study of only two sources doesn’t allow us to determine the reasons for differences between them. Live rock a and b differed in many ways including geographical origins (Fiji vs Tonga), porosity (solid vs porous), coverage with encrusting algae and invertebrates (high vs low), and composition (concrete and rubble vs natural coral skeletons).
All we can conclude with certainty is that appearances can be very deceiving. In this case, the prettier rock with extensive surface growth proved to be far inferior to the rock with very little surface growth. While it’s tempting to speculate that the highly porous structure of natural coral is important for high-quality live rock, further experiments are needed to determine whether that factor alone explains the difference. At present, it appears that if we want to know about the microbiome of live rock there is no substitute for measuring this directly, just like any other aspect of aquarium conditions (e.g. water chemistry or light intensities).
Speaking for myself, I won’t be starting any new tanks with dry rock unless I’m using them for an experiment. From a microbial perspective, it’s clear that live rock is an effective tool for rapidly establishing a microbial community like that of an established reef tank, and I’ve seen no evidence yet that dry rock – on its own – can achieve a similar community.
Since I know that will be a controversial statement I want to be precise about it. I am aware that many beautiful and successful reef tanks were started with dry rock – including some of those with the highest-scoring microbiomes in my previous survey of reef tanks.
What my controlled experiment shows is that diverse and balanced microbial communities do not just emerge automatically when dry rock is submerged in water. Instead, those microbes must be introduced. Successful reef keepers have come up with many ways of introducing beneficial microbes, including seeding the tank with small amounts of live rock rubble or live sand. Based on the experiments described here, I conclude that hobbyists who have succeeded in producing diverse and balanced microbial communities despite the use of dry rock have introduced beneficial microbes in some way… and I’ll be interested to hear how people have done so.
Further experiments are needed to systematically study the many products sold to promote a healthy microbiome in a new aquarium. By directly measuring the effects of these products using microbiome testing, the community can identify evidence-based best practices for starting a new aquarium with a healthy microbiome. We have a lot left to learn!
-Eli Meyer
AquaBiomics
© Aquabiomics LLC, 2019 | About us | Contact us | FAQ
How aquarium microbiomes differ
How Aquarium Microbiomes Differ
Aquarium microbiomes are not all the same
To survey variation in aquarium microbiomes I teamed up with a group of local aquarists and coral growers to sample 20 established reef tanks maintained by 11 different aquarists. Each member of the team sampled their own tank(s), and I analyzed microbial DNA in each sample to study the microbial communities in saltwater aquariums.
This analysis showed both similarities and differences. In a previous article, I’ve focused on the similarities to describe the “core aquarium microbiome”, a group of microbial families that were found in nearly all tanks. The goal in that article was to introduce the most abundant groups of microbes in reef tanks.
In this article, I’ll focus instead on the differences among tanks. When aquarium microbiomes deviate from the usual pattern, what kind of differences do we find? My goal here is to describe the scope of this variation, and the kinds of patterns observed repeatedly in different tanks. Describing these patterns is a starting point for further studies aiming to understand the reasons for this variation.
Some of these things are not like the others
Our first goal was simply to evaluate which aquariums’ microbiomes had the most in common. This is not a trivial task considering the thousands of different bacterial types identified in these samples.
To simplify these data I turned to a statistical approach traditionally used by ecologists to compare different communities. I apologize for the jargon, but the method is called “Principle Coordinate Analysis” (you can read more about how this is used to study microbiomes here and here, if you’re into that sort of thing).
The point of this approach is to identify the two dimensions that explain most of the variation among samples, and graph the samples based on those two dimensions. (You can think of each dimension as representing a list of ways in which the samples are similar or different). The method provides a visual answer to the question, which samples were alike and which were different?

Figure 1. Similarities and differences between the microbial communities of 20 different aquariums (circles) maintained by different owners (different colors). Symbols close together have similar microbiomes. Clusters of similar aquariums are indicated by dashed lines, and labeled with arbitrary letters (a-d) for discussion in the text.
This analysis identifies four groups of tanks, each cluster with its own characteristic microbial community. The largest group (group a) contained half the tanks we sampled, including 10 tanks maintained by 7 different aquarists.
Another group of 3 tanks (group b) differed from all other aquariums sampled in this study, but shared similar microbiomes even though these were owned and sampled by three different people. A pair of tanks operated by a single aquarist comprised group c. Interestingly, another tank operated by the same person (light blue symbols in Fig 1) was a member of group a. The final group of 5 tanks were all operated by a single person, all of whose tanks belonged to this group d.
In interpreting these results, it’s important to recognize that all 20 tanks sampled here were established reef tanks in good condition. While most of the owners reported one or more issues with their tanks (e.g. nuisance algae or RTN), they also reported that most or all livestock in these tanks were healthy. So the differences discussed here reflect a range of different microbial communities that can support a functional reef tank.
Group a: the consensus microbiome
The microbial community in group a is generally similar to the core aquarium microbiome described in a previous article. All 19 families of the core aquarium microbiome can be readily identified in the group a microbiome (Figure 2).

Group a includes half of all aquariums we sampled, including tanks owned by the majority of participants (7 out of 11, or 64% of participants). The microbial community observed in this group occurs more frequently (50% of aquariums sampled) than any of the other patterns we observed (range: 10-25%). For these reasons, I interpret the composition and relative abundance of this microbial community as the consensus microbiome, and will refer to it as such in this report.
The microbial communities in group a were more diverse than the other groups. The average aquarium in group a contained 471 different microbial types, substantially higher than the diversity in any other group (range: 300-318).
The distribution of microbial families in group a was more even than other groups, which were dominated by a few highly abundant families (see below). For comparison, the top 3 most abundant families account for only 32% of the community in group (a), but account for 47-83% of the community in the other groups.
Beneficial microbes with known roles in nutrient processing were generally more abundant in the consensus microbiome than other groups. Ammonia-oxidizing microbes (both Bacteria and Archaea, AOB & AOA) made up 1.9% of the consensus microbiome, but were less abundant in other groups, contributing 0.2-0.3% on average.
Similarly, nitrite-oxidizing bacteria (NOB) were much more abundant in the consensus microbiome (0.2%) than in other groups (0-0.01%). (Since these nutrient processing microbes are much more abundant in biofilm than the water column, levels of zero should not be interpreted as absence in the whole aquarium, but rather as levels below the limit of detection in the water column).
The above description suggests the consensus microbiome is superior to outlier groups, but examining the levels of unwanted microbes presents a more nuanced perspective. Cyanobacteria were actually present at slightly elevated levels in the consensus microbiome (0.7% on average) compared with other groups (0.03-0.5%).
Bacterial fish pathogens were detected in several tanks, generally at low levels. These made up 0.17% of the consensus microbiome on average compared with 0-0.03% in other groups. (Although I also searched for known coral pathogens, I found no evidence of these in any tanks we sampled). This picture is further supported by a comparison of the core family Vibrionaceae (a family with many known pathogens), which was present at higher levels in group a (7% of the community) than any other group (range: 1-2% of the community; Figure 2).
Overall, this analysis shows that the consensus microbiome in group a is highly diverse, including all of the core microbial families at relatively even levels (compared with other groups). The consensus microbiome contains elevated levels of beneficial microbes compared with other groups. Interestingly, group a also contains elevated or similar levels of harmful or nuisance bacteria as the other groups. The presence of these microbes in the consensus microbiome of healthy reef tanks suggests that microbial problems in aquariums (e.g. disease or cyanobacterial blooms) are not simply driven by introduction of unwanted microbes, but are affected instead by interactions between these microbes and the rest of the microbial community.
Microbial communities in the other aquariums differed from the consensus microbiome in several ways. First, the abundance of several core families differed across groups. Second, some groups contained additional, unexpected families that were not found in the consensus microbiome. Finally, the outlier groups contained lower levels of both beneficial and harmful microbes than the consensus.
I’ll discuss these groups one by one, interpreting each group as a specific kind of deviation from the consensus microbiome.
Group b: profoundly different microbial communities
The microbial communities in group b diverged from the consensus more than any other group. Group b includes only 3 aquariums, but it’s interesting to note that each belonged to a different participant. This similarity (Figure 1, group b) suggests that the deviations from consensus observed in group b are not just random accidents in a single tank, but may result from some practice(s) employed by multiple aquarists.
Microbial communities in group b were substantially less diverse (318 types per tank, on average) than the consensus microbiome. The distribution of microbial families was comparable to the consensus in terms of evenness (Figure 2). About half of the community (47%) was contained in the top 3 most abundant families (Rhodobacteraceae, Alteromonadaceae, & Hyphomicrobiaceae), slightly more than in the consensus (32%). The composition was notably different, though. Neither Rhodobacteraceae nor Hyphomicrobiaceae was ranked among the top 3 most abundant families in the consensus microbiome (Vibrionaceae, Pelagibacteraceae, & Alteromonadaceae).
Many of the families of the core aquarium microbiome were absent or present at much lower levels in group b than in the consensus, including Flavobacteriaceae, Pelagibacteraceae, Vibrionaceae, Fusobacteriaceae, and Pseudoalteromonadaceae. Together these families account for 41% of the consensus microbiome but only 5% of the community in group b.
In their place, several core families were present at unusually high levels relative to the consensus. Together these families (Rhodobacteraceae, Alteromonadaceae, and Hyphomicrobiaceae) account for 47% of the community in group b, compared with only 16% of the consensus community.
The communities in this group also contained several additional families that were not part of the core microbiome. Together these families (Cohaesibacteraceae, Coxiellaceae, Legionellaceae, Phyllobacteriaceae, and Sinobacteraceae) made up 19% of the community in group b but were very rare in the consensus community, contributing only 2% altogether. Additional details about these families are shown in Table 1.
Table 1
Additional microbial families found in group b, that are not part of the core aquarium microbiome.Family | Description | Metabolic capabilities | Ecological roles & responses | |
---|---|---|---|---|
1 | Cohaesibacteraceae | Gram-negative, rod-shaped, motile Bacteria (Alphaproteobacteria) | Aerobic or facultatively anaerobic, chemoheterotrophic | Found in samples from coastal waters and mariculture ponds, but little is known about the ecology or physiology of this group. Capable of growth on a variety of carbon sources including sugars, amino acids, and other organic acids. |
2 | Legionellaceae | Gram-negative, rod-shaped, motile Bacteria (Gammaproteobacteria) | Aerobic, chemoheterotrophic | Widely distributed in aquatic environments, tolerant of high temperatures. Many are capable of infecting humans and leading to legionellosis. Specifically requires amino acids as a carbon source for growth. |
3 | Phyllobacteriaceae | Gram-negative; round or rod-shaped; Bacteria (Alphaproteobacteria). Some are motile. | Most aerobic & chemoheterotrophic | Found in soil and water sample, or associated with plants including nodules and rhizospheres. Plays important roles in nitrogen fixation for terrestrial plants. Some vitamin requirements for growth (e.g. biotin/B7). Capable of growth on a variety of carbon sources including sugars, amino acids, and other organic acids. Some capable of nitrate reduction. |
4 | Chromatiaceae | Gram-negative, varies widely in shape and motility (Gammaproteobacteria) | Some are anaerobic & photolithotrophic, relying on sulfide; others are aerobic & photoheterotrophic | Widely distributed in stagnant, well-lit, aquatic habitats, especially marine shorelines. Forms colored layers of biofilm in sediments in a variety of aquatic habitats. Many are dependant on vitamin B12 for growth. |
5 | Sinobacteraceae | Gram-negative, rod-shaped Bacteria (Gammaproteobacteria). Some are motile | Chemoheterotrophic, aerobic or facultatively anaerobic | Typically found in soil or freshwater, since most strains are sensitive to NaCl. A few can grow in marine conditions. These can grow on a wide range of sugars, amino acids, and other organic acids |
The microbial communities in group b contained lower levels of beneficial nutrient-processing microbes than the consensus microbiome. AOB & AOA made up only 0.28% of the community in this group, nearly 7 times lower than their abundance in the consensus community. NOB contributed only 0.01% to the group b community, 23-times lower than their contribution to the consensus community.
On the other hand, group b also contained lower levels of nuisance microbes and pathogens. Cyanobacteria made up only 0.03% of the group b microbiome, 20-times less than in the consensus. No pathogens of fish or corals were detected in any samples from group b.
Overall, the microbiomes in group b were profoundly different from the consensus in abundance, composition, and the levels of beneficial and harmful bacteria. The known differences in nutrient requirements and metabolic capacities of these microbial families suggests functional differences between group b communities and the consensus communities in group a. Specifically, most of the families enriched in group b (Table 1) are capable of growth on dissolved acids, and one (Legionellaceae) requires amino acids for growth. Two of these families (Phyllobacteriaceae & Chromatiaceae) require B-vitamins (B7 and B12 respectively) for growth. Together, these observations suggest that the different microbial communities in group b may be driven by differences in nutrient profiles. However, since the notes about these tanks recorded by the owners did not reveal any consistent practices that would explain this (e.g. dosing of amino acids), the cause of these differences remains unknown.
Groups c & d: communities dominated by a few families
Both of the remaining outlier groups (c & d, Figure 1) differed from the consensus in a similar way – both were dominated by a pair of families (Flavobacteriaceae & Pelagibacteraceae) that were already abundant in the consensus microbiome (together, accounting for 17.5% of the community), but even more so in groups c and d (66% and 75% of these communities respectively). Notably, the ratio between these two families differed substantially between groups, with group c dominated by Flavobacteria while the two families were present at comparable levels in group d (Figure 2).
Both groups were less diverse than the consensus microbiome, with 308 and 337 microbial types on average respectively.
In both groups, the increased relative abundance of Flavobacteriaceae & Pelagibacteraceae is accompanied by corresponding reductions in the relative abundance of other core families. The simplest interpretation of this pattern is that Flavobacteriaceae & Pelagibacteraceae are truly present at higher levels, pushing the relative abundance of all other families lower without any real changes in their absolute abundances.
In this context, it’s interesting to note that a few families resisted this trend and were actually present at higher levels in groups c or d than in the consensus. These families are the main difference between groups c and d, which are otherwise very similar. Rhodobacteraceae was slightly more abundant in group c (10% of the community) than in the consensus (7%). Cryomorphaceae was much more abundant in group d (8.4% of the community) than in the consensus (1.6%).
Groups c and d were similar in their content of nutrient-processing microbes, which were less abundant in both groups than in the consensus. AOA & AOB were about 9-times less abundant in these groups (0.2% and 0.3% in c and d respectively) than in the consensus microbiome (1.9% of the community). NOB were much less abundant in these groups; none were detected in group c, and the levels in group d (0.005%) were 40-times lower than the consensus (0.2%). As discussed above, the increased abundance of Flavobacteriaceae & Pelagibacteraceae relative to all other families decreases the relative abundance of other families, which may account for the differences described here without any real decrease in nutrient processing communities.
Cyanobacteria were much less abundant in group c (0.03% of the community) than in the consensus microbiome (0.7%). In contrast, group d showed similar levels of cyanobacteria as the consensus (0.5%). Both groups showed lower levels of fish pathogens (0% and 0.02%) than the consensus (0.17%), which could similarly be explained entirely by the elevated levels of Flavobacteriaceae & Pelagibacteraceae in these groups.
What could cause these differences?
Deviations from the consensus microbiome can be largely understood as excesses in or more of six microbial families (Flavobacteriaceae, Pelagibacteraceae, Rhodobacteraceae, Hyphomicrobiaceae, Alteromonadaceae, and Cryomorphaceae).
These families together make up a large fraction of the microbiome in most samples, and variation in their relative levels explains a majority of the variation among microbiomes. Based on these observations, we can conclude that the factors driving variation in these families’ growth are likely to be important for driving the overall community structure.
All six families are primarily or exclusively aerobic chemoheterotrophs. In other words, they require oxygen and get their metabolic energy by oxidizing organic compounds from the environment. The abundance of microbes with this lifestyle is typically determined by the availability of the specific nutrients each is capable of processing. These six families differ in their nutritional requirements, including requirements for specific compounds such as methylated amines (MA), reduced sulfur compounds (e.g. DMSP), and specific amino acids (e.g. glycine). (read more here)
The specificity of these requirements suggests the hypothesis that variation in unmeasured dissolved nutrients drives the majority of variation in aquarium microbiomes. Specifically, reduced sulfur compounds (e.g. DMSP), carbon sources (e.g. polysaccharides and simple sugars), and nitrogen sources including methylamines, proteins, and amino acids are important for the growth of these groups. Few if any aquarists measure or deliberately dose these individual compounds, although many are present in commonly used foods. DMSP is a natural algal metabolite, and amino acids are present in all protein-containing foods. The existing variation probably results from variation in the addition of these compounds in food or production through natural biological processes in each aquarium (e.g, DMSP production by algae).
Now that microbiome testing is readily available for aquariums, it will be interesting to learn how deliberate manipulation of the nutrient profiles in aquariums can be used to adjust their microbiomes.
Summary
This comparison of microbial communities in saltwater aquariums revealed that while there is a consensus community found in half of the aquariums we tested, not every tank is the same. Interestingly, the deviations from the consensus that we saw in this survey fell into a few clear patterns. Some tanks (group b) harbored communities that were comparable to the consensus in diversity and evenness, but were composed of different, unexpected microbial families. The microbial communities in other tanks (groups c & d) included primarily the same families as the consensus community, but these were much less even than the consensus, with a few families dominating each community.
If every aquarium had an identical microbial community, there would be no use in measuring these communities in different tanks. On the other hand, if each community was completely different without any similarities, it would be very difficult to study the causes of this variation, or its effects on aquarium conditions.
In fact, we find that most tanks share a core set of families at similar levels, while a few tanks deviate from this consensus in systematic ways. This pattern suggests that these communities have been affected by systematic differences in the setup or maintenance of these aquariums.
As we continue to gather data from additional tanks, I hope to identify the factors that drive these communities in one direction or another, so that aquarists can not only test their aquarium’s microbiome but also adjust it.
Stay tuned!
-Eli Meyer, AquaBiomics
Note: most of these are not publicly accessible. Sometimes the authoritative source is not made publicly available by the publishers. I include the list for readers with institutional access who wish to look into the sources on which I based this article.
[zotpress userid=”5983543″ category=”CSAM”]
© Aquabiomics LLC, 2019 | About us | Contact us | FAQ
The core microbiome of a saltwater aquarium
The Core Microbiome of a Saltwater Aquarium
What’s in the microbiome of a saltwater aquarium?
Aquarists have known for a long time that microbes played important roles in our aquariums, but have been unable to directly measure the microbial communities in their tanks until recently.
To better understand these microbial communities, I’ve teamed up with a group of local hobbyists and coral growers to sample microbial communities in a wide variety of tanks. In my new lab at AquaBiomics I used DNA sequencing to identify the different kinds of microbes present in each tank, and measure their relative abundance.
By comparing these communities across different tanks, I identified a core set of families found in nearly all aquariums we sampled. My goal in this report is to introduce these families of microbes, for aquarists interested in learning more about the microbes living in their own tanks.
How DNA sequencing is used to study the microbiome
For this study, my collaborators sampled seawater from multiple tanks using custom sampling kits I provided, then shipped the samples back to my lab at AquaBiomics. Altogether we sampled 20 tanks operated by 7 people, ranging from home display tanks to coral aquaculture facilities.
We chose to sample microbial populations in the water because this can be sampled more consistently across tanks than other strategies (e.g. sand, rock, etc.) I view this as analogous to sampling a patient’s blood to diagnose issues with their heart or liver. Our approach is supported by a recent study which found that water samples are ideal for measuring ecosystem disturbances on natural coral reefs.
Very few (probably <1%) of microbes can be grown in culture, so many researchers now use DNA sequencing to study these communities. I extracted DNA from each sample, and sequenced a genetic marker called 16S that’s been widely used for studies of microbial communities in natural habitats. To ensure that we sampled the community deeply enough to detect rare microbes, I analyzed about 10,000 DNA sequences per sample. By comparing these sequences with public databases, I identified the type of microbe from which each DNA sequence was extracted, and counted these sequences to evaluate the relative abundance of each type.

Established saltwater aquariums support diverse microbial communities
These data revealed that the water circulating through a typical saltwater aquarium contains a complex mixture with hundreds of different kinds of microbes. In our survey of hobbyist and aquaculture systems we found 400 different types per tank on average.
The variation across aquariums was striking; the most diverse tank we sampled contained more than 7 times as many microbial types as the least diverse. Most tanks (80%) contained at least 300 microbial types, but some contained far fewer (Figure 2).

Why does this diversity matter? After all, as aquarists we aren’t really interested in the names of the microbes, as much as we are in what they can do for us.
Classifying each microbe to the family level reveals that the hundreds of different types in each sample represented a large number of different families (90 different families per sample, on average).
These families have have different, characteristic metabolic activities and play different roles in nature and presumably in our aquariums. So this diversity is not just a matter of DNA sequences; the different kinds of microbes do different things.
Aquarists have often debated what makes a tank “mature”. From a microbial perspective, our analysis of established, mature saltwater aquariums establishes a target range for microbial diversity, providing an objective metric for determining the maturity of a new tank.
The aquarium water microbiome is dominated by a few families
In addition to identifying the kinds of microbes present in each sample, DNA sequencing provides information on each types’ relative abundance (in other words, the ratios between the different types). This analysis revealed that a relatively short list of families accounted for the majority of the aquarium water microbiome (Figure 3).

These observations demonstrate that there is a core microbiome characteristic of mature saltwater aquariums. These families were present in almost every tank we sampled, and made up a relatively large fraction of the community in each tank. Disruptions of this core microbiome may contribute to otherwise unexplained problems like reduced water quality, nuisance algae, and coral or fish diseases.
To identify the core saltwater aquarium microbiome, we focused on the set of 19 families that each made up at least 1% of the community, on average. Together, these “core” families accounted for 73% of the total community. Two of these were especially abundant (Pelagibacteraceae and Flavobacteriaceae), each accounting for about 16% of the total community (Fig 3). The other “non-core” families (158) were each present in fewer tanks and at very low levels (0.17% of the community on average).
In the remainder of this article, we focus on describing these core families that account for the majority of the water microbiome across almost all tanks we sampled.
The 19 microbial families in the core aquarium microbiome
Each of these core families is described in the following table. These descriptions focus on marine members of each family, when specific information was available about marine groups. (Note: if this table does not display well on your mobile device, consider switching to the Desktop version of the site to view this table.)
Table 1
Microbial families of the core saltwater aquarium microbiome.Family | Description | Metabolic capabilities | Ecological roles & responses | |
---|---|---|---|---|
1 | Flavobacteriaceae | Gram-negative, rod-shaped, non-motile or gliding Bacteria (Bacteroidetes) | Generally aerobic & chemoheterotrophic | Most diverse family in Bacteroidetes; occurs in essentially all habitats. Specialized for degrading polysaccharides & proteins. Often the most abundant group in aquatic habitats. Frequently associated with surfaces, including animals, macroalgae, or detritus. |
2 | Pelagibacteraceae | Gram-negative, rod-shaped, free-living Bacteria (Alphaproteobacteria) | Aerobic & chemoheterotrophic | Previously called SAR11, this is thought to be the most abundant bacterial group in the ocean worldwide. Well-adapted for life in the low-nutrient waters of the open ocean. Require reduced sulfur compounds, glycine, and dissolved organic carbon for growth. |
3 | Rhodobacteraceae | Gram-negative Bacteria (Alphaproteobacteria), mostly rod-shaped, some free-living | Mostly aerobic & chemoheterotrophic, some photoheterotrophic | Extremely diverse, widely distributed and highly abundant in marine habitats including open ocean, sediments, and algal biofilms. Degrade sulfur-containing compounds (e.g. sulfite, DMSP). Many use methylated amines (MA) as primary nitrogen source. |
4 | Vibrionaceae | Gram negative, motile, Bacteria (Gammaproteobacteria); curved or straight rod-shaped | Aerobic or anerobic; chemoheterotrophic, photoautotrophic, or chemoautotrophic; some biolumenescent. | Widely distributed in marine habitats, including many associations with animals. This family includes many human or animal pathogens, including bacteria that can cause wound infection from exposure to contaminated water. |
5 | Alteromonadaceae | Gram-negative, rod-shaped, motile Bacteria (Gammaproteobacteria) | Aerobic & chemoheterotrophic | Widely observed in seawater samples. Can use a broad range of dissolved nutrients including sugars and amino acids, and blooms in high glucose conditions. |
6 | Cryomorphaceae | Gram-negative, rod-shaped or filamentous Bacteria (Bacteroidetes). Non-motile or gliding. | Aerobic or facultatively anerobic; chemoheterotrophic. | Primarily marine microbes, with some freshwater members. Generally surface-associated. Not primary degraders, but contribute to secondary production. Metabolizes amino acids and other organic acids. Nutritonal requirements remain poorly defined, but supported by organic extracts (e.g. yeast). |
7 | Oceanospirillaceae | Gram-negative, spiral- or rod-shaped, motile Bacteria (Gammaproteobacteria) | Aerobic & chemoheterotrophic | Almost exclusively marine. Grows on amino acids, other organic acids, and ammonia. Contributes to biofilm communities, and growth is stimulated by nutrient enrichment (C, N, & P). |
8 | Pseudoalteromonadaceae | Gram-negative, rod-shaped or round, motile Bacteria (Gammaproteobacteria) | Aerobic & chemoheterotrophic | Ecologically important in a wide variety of marine habitats. Produce a variety of bioactive compounds, including many antimicrobial or antiviral comounds. Plays important roles in the formatin of biofilms. Can inhibit establishment and growth of algae. High molecular weight DOM promotes growth of this family. |
9 | Mycobacteriaceae | Not truly Gram-positive or negative, rod-shaped, non-motile Bacteria (Actinobacteria) | Aerobic; mostly chemoheterorophic | Grows on a variety of simple sugars, alcohols, or hydrocarbons. Growth is promoted by addition of fatty acids. Not generally pathogenic or symbiotic, but includes a few very important human pathogens (leprosy, tuberculosis). Includes the aquarium-related pathogen M. marinum (‘fish-tank granuloma’). |
10 | Fusobacteriaceae | Gram-negative, rod-shaped or round, non-motile Bacteria (Fusobacteria) | Anaerobic or microaerophilic, chemoheterotrophic | Occurs in a variety of habitats. Ferments organic nutrients including carbohydrates, amino acids, and peptides. Found in sediments and associated with animals. |
11 | Hyphomicrobiaceae | Gram-negative Bacteria (Alphaproteobacteria) with round to rod-shaped cells, some motile | Includes chemoheterotrophic, methylotrophic, chemolitoautotrophic, and photosynthetic | Found in essentially every habitat. Grows on organic acids and sugars. |
12 | Saprospiraceae | Gram-negative rod-shaped Bacteria (Bacteroidetes), some show gliding motility | Aerobic & chemoheterotrophic | Primarily marine, some freshwater. Typically associated with sediments, multicellular organisms, or other surfaces. Capable of breaking down and living on complex macromolecules (e.g. polysaccharides, proteins). Some prey on other bacteria or algae, suggesting a role for this group in controlling algal growth on surfaces. |
13 | Bacteriovoracaceae | Gram-negative, rod-shaped, motile Bacteria (Deltaproteobacteria) | Aerobic or anerobic; chemoheterotrophic | Widely distributed across aquatic and terrestrial ecosystems. Obligate predators of other gram-negative bacteria. Play important roles in controlling microbial community size and diversity. |
14 | Bacillaceae | Gram-positive, rod-shaped, motile Bacteria (Firmicutes) | Aerobic or anaerobic; chemoheterotrophic | The hardiest and mos widely distributed group of bacteria. Spore-forming. Found throughout aquatic and terrestrial habitats, often in association with plants or animals. Primarily saprophytic. Plays important roles in nutrient cycling. Capable of degrading and living on complex macromolecules or simple sugars. Blooms rapidly in response to nutrient addition. |
15 | Flammeovirgaceae | Gram-negative, rod-shaped Bacteria (Bacteroidetes) | Aerobic or anaerobic; chemoheterotrophic | Occurs in both terrestrial and aquatic habitats. Commonly observed in marine sediments. Litle information is available on their activity. |
16 | Piscirickettsiaceae | Gram-negative, rod-shaped, Bacteria (Gammaproteobacteria), some motile | Aerobic & chemoheterotrophic | A diverse group with a broad range of activities. Includes methylotrophic bacteria with important roles in carbon cycles, and a fish pathogen Piscirickettsia salmonis |
17 | Cenarchaeaceae | Round or rod-shaped Archaea (Thaumarchaeota), some motile | Aerobic, chemoautotrophic | Found in essentially all habitats including extreme environments. Important ammonia-oxidizing activities, especially when ammonia levels are low; ammonia-oxidizing Archaea consume more ammonia than AOB. |
18 | Comamonadaceae | Gram-negative, round or rod-shaped Bacteria (Betaproteobacteria), some motile | Generally aerobic heterotrophic; many exceptions | A large and diverse group that includes a wide range of lifestyles. Occurs in soil and water samples from a wide range of habitats, and in association with plants or animals. Most are free-living saprophytes. Some grow autotrophically on hydrogen or nitrate. |
19 | Marinicellaceae | Gram-negative, rod-shaped, non-motile Bacteria (Gammaproteobacteria) | Aerobic & chemoheterotrophic | Newly described family occuring in seawater samples. Little information is available on its ecological roles. Requires salt and organic nutrients (e.g. hydrolyzed proteins) for growth. |
Microbes of special interest for aquarists
Table 2
The average abundance of microbial groups of interest in a typical saltwater aquarium.Group | Types found | Average % of community |
---|---|---|
Ammonia-oxidizing Bacteria | Nitrosomonadaceae, Nitrosococcus | 0.67% |
Ammonia-oxidizing Archaea | Cenarchaeaceae | 0.85% |
Nitrite-oxidizing Bacteria | Nitrobacter, Nitrospinaceae, Nitrospiraceae | 0.14% |
Cyanobacteria | Acaryochloridaceae, Phormidiaceae, Pseudanabaenaceae, Synechococcaceae, Ulvophyceae, Xenococcaceae | 0.32% |
Fish pathogens | Photobacterium damselae, Piscirickettsia salmonis | 0.07% |
Coral pathogens | none | 0.00% |
Summary
- The water in a typical reef tank contains hundreds of different types of microbes with diverse metabolic capabilities.
- The aquarium microbiome is dominated by a core set of 19 families that are relatively abundant in most tanks.
- Bacteria made up most of the aquarium microbiome, but the small number of Archaea include types with important roles in nutrient processing
- Sampling the water of a saltwater aquarium allows for detection of specific beneficial microbes or pathogens
- The differences in metabolic capabilities and nutritional requirements in the core saltwater aquarium microbiome suggest that the microbiome composition can affect dissolved nutrient levels, and vice versa.
© Aquabiomics LLC, 2019 | About us | Contact us | FAQ