Aquarium microbiomes are not all the same
To survey variation in aquarium microbiomes I teamed up with a group of local aquarists and coral growers to sample 20 established reef tanks maintained by 11 different aquarists. Each member of the team sampled their own tank(s), and I analyzed microbial DNA in each sample to study the microbial communities in saltwater aquariums.
This analysis showed both similarities and differences. In a previous article, I’ve focused on the similarities to describe the “core aquarium microbiome”, a group of microbial families that were found in nearly all tanks. The goal in that article was to introduce the most abundant groups of microbes in reef tanks.
In this article, I’ll focus instead on the differences among tanks. When aquarium microbiomes deviate from the usual pattern, what kind of differences do we find? My goal here is to describe the scope of this variation, and the kinds of patterns observed repeatedly in different tanks. Describing these patterns is a starting point for further studies aiming to understand the reasons for this variation.
Some of these things are not like the others
Our first goal was simply to evaluate which aquariums’ microbiomes had the most in common. This is not a trivial task considering the thousands of different bacterial types identified in these samples.
To simplify these data I turned to a statistical approach traditionally used by ecologists to compare different communities. I apologize for the jargon, but the method is called “Principle Coordinate Analysis” (you can read more about how this is used to study microbiomes here and here, if you’re into that sort of thing).
The point of this approach is to identify the two dimensions that explain most of the variation among samples, and graph the samples based on those two dimensions. (You can think of each dimension as representing a list of ways in which the samples are similar or different). The method provides a visual answer to the question, which samples were alike and which were different?
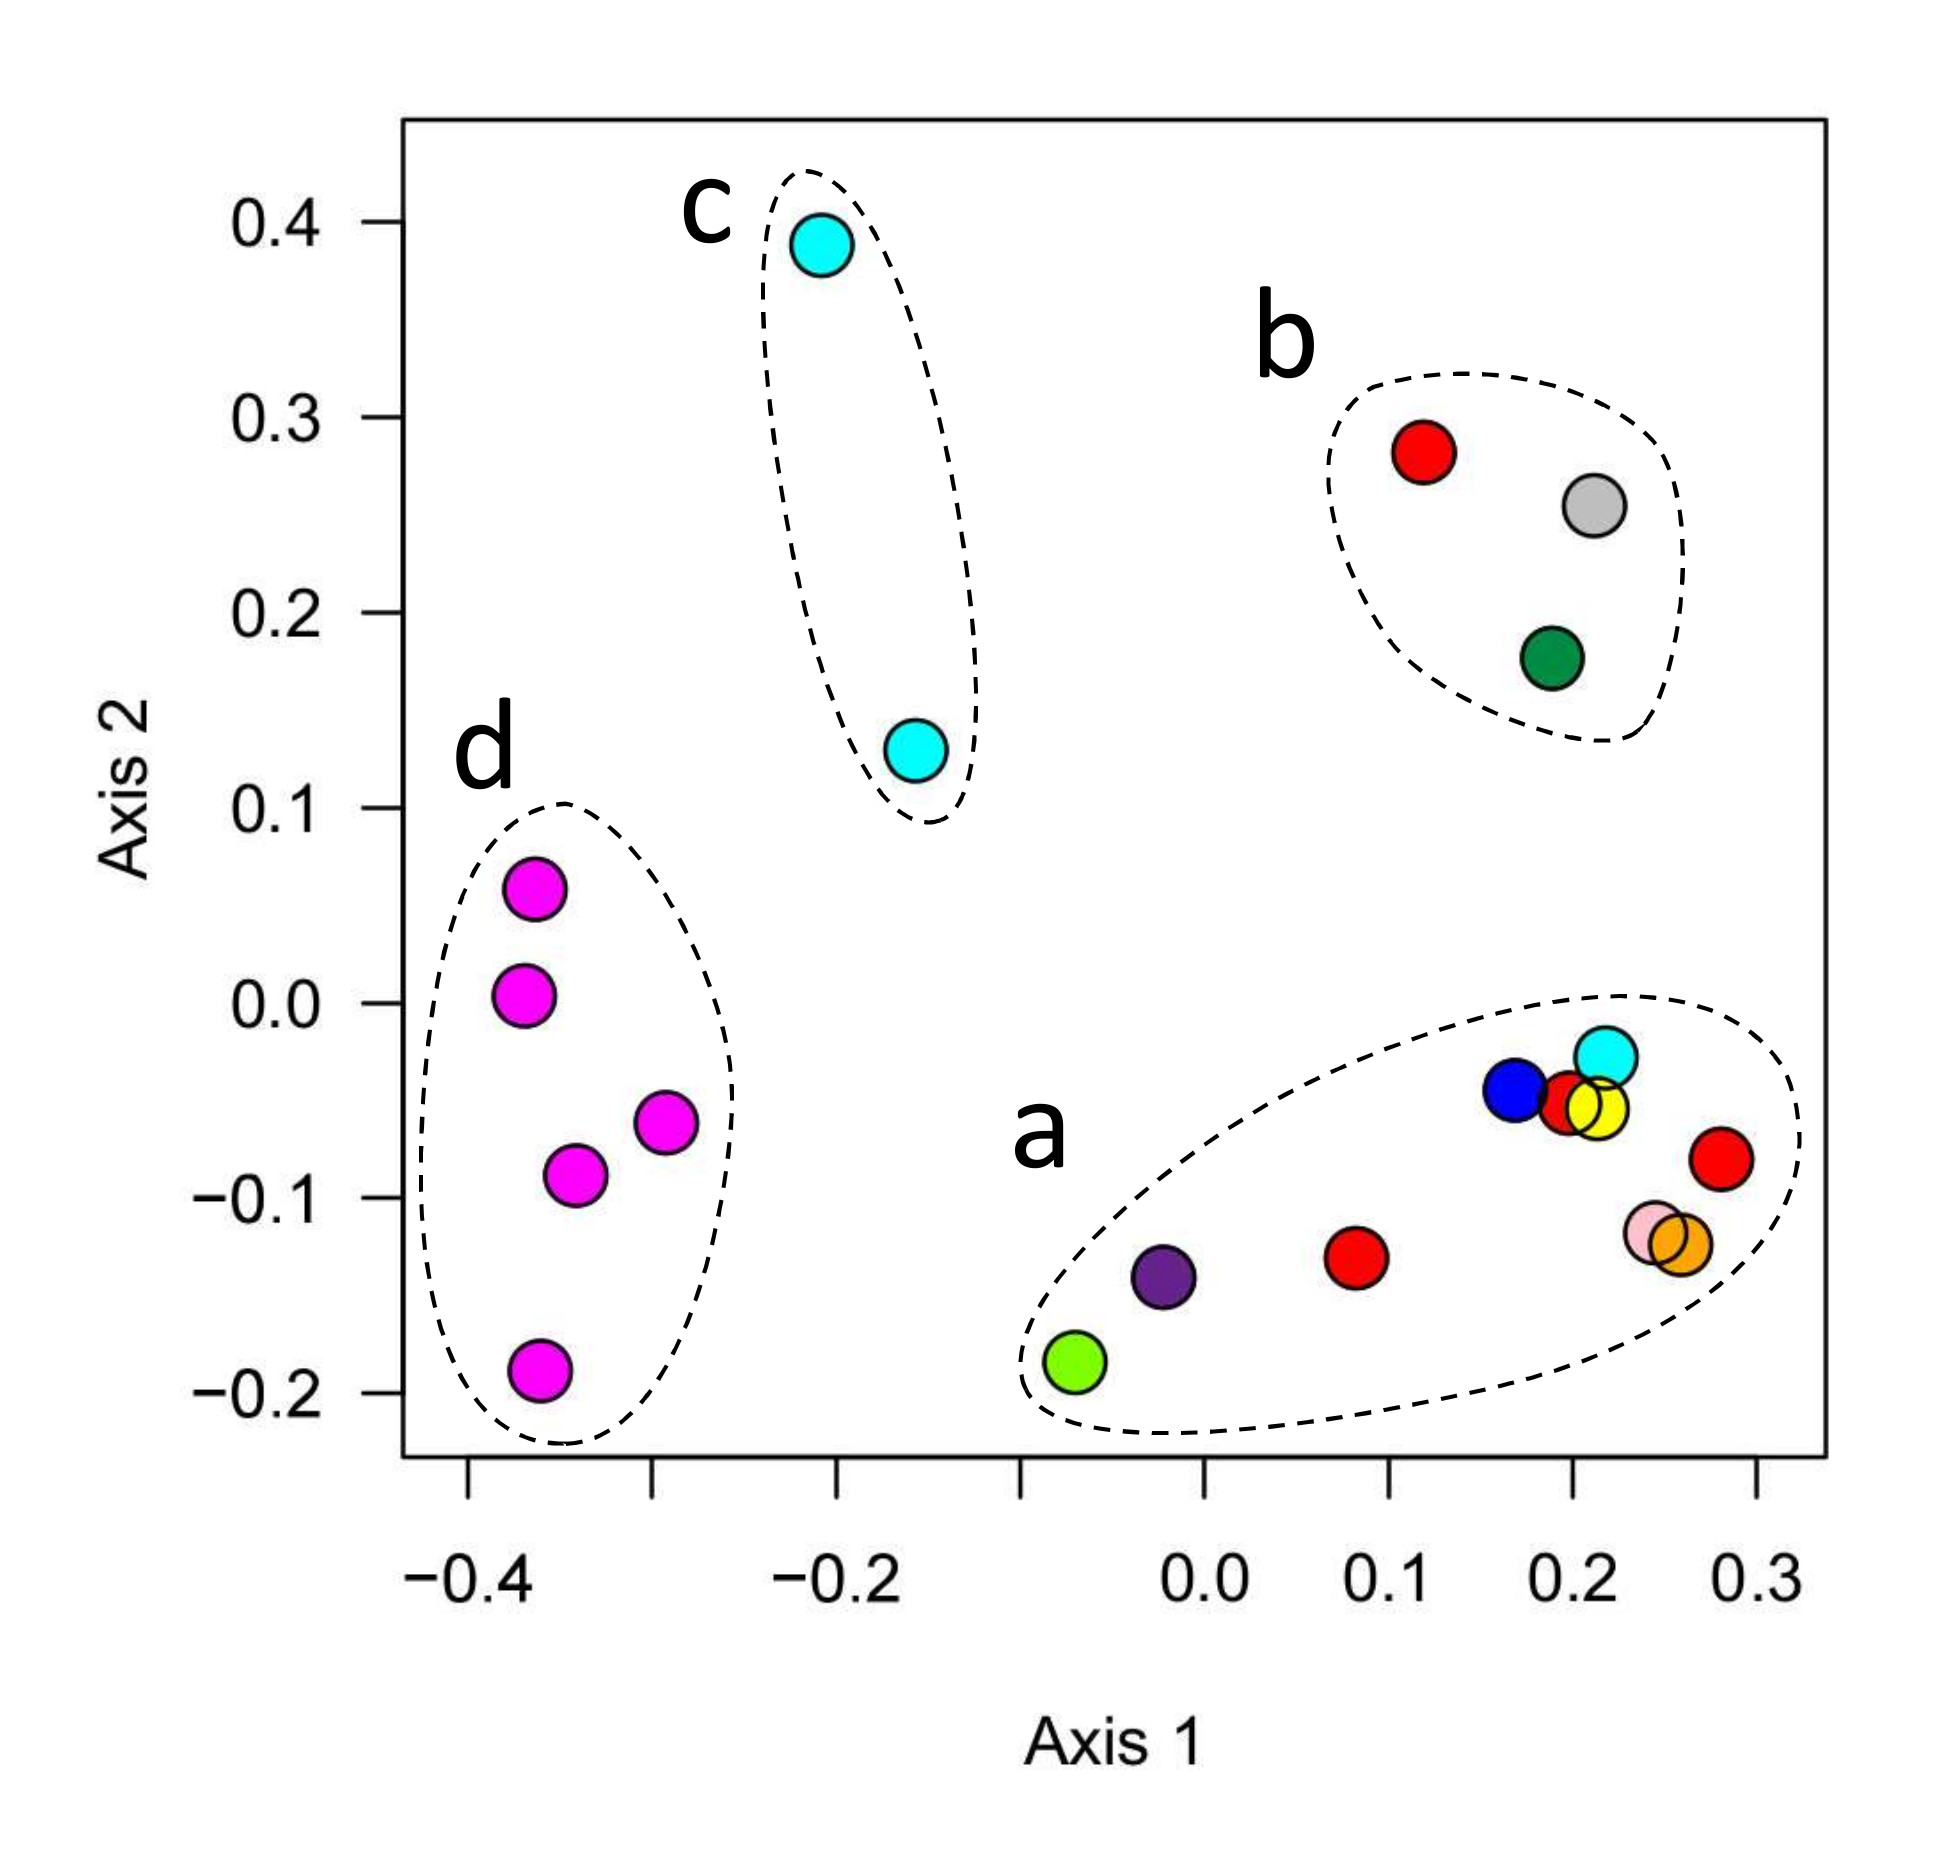
Figure 1. Similarities and differences between the microbial communities of 20 different aquariums (circles) maintained by different owners (different colors). Symbols close together have similar microbiomes. Clusters of similar aquariums are indicated by dashed lines, and labeled with arbitrary letters (a-d) for discussion in the text.
This analysis identifies four groups of tanks, each cluster with its own characteristic microbial community. The largest group (group a) contained half the tanks we sampled, including 10 tanks maintained by 7 different aquarists.
Another group of 3 tanks (group b) differed from all other aquariums sampled in this study, but shared similar microbiomes even though these were owned and sampled by three different people. A pair of tanks operated by a single aquarist comprised group c. Interestingly, another tank operated by the same person (light blue symbols in Fig 1) was a member of group a. The final group of 5 tanks were all operated by a single person, all of whose tanks belonged to this group d.
In interpreting these results, it’s important to recognize that all 20 tanks sampled here were established reef tanks in good condition. While most of the owners reported one or more issues with their tanks (e.g. nuisance algae or RTN), they also reported that most or all livestock in these tanks were healthy. So the differences discussed here reflect a range of different microbial communities that can support a functional reef tank.
Group a: the consensus microbiome
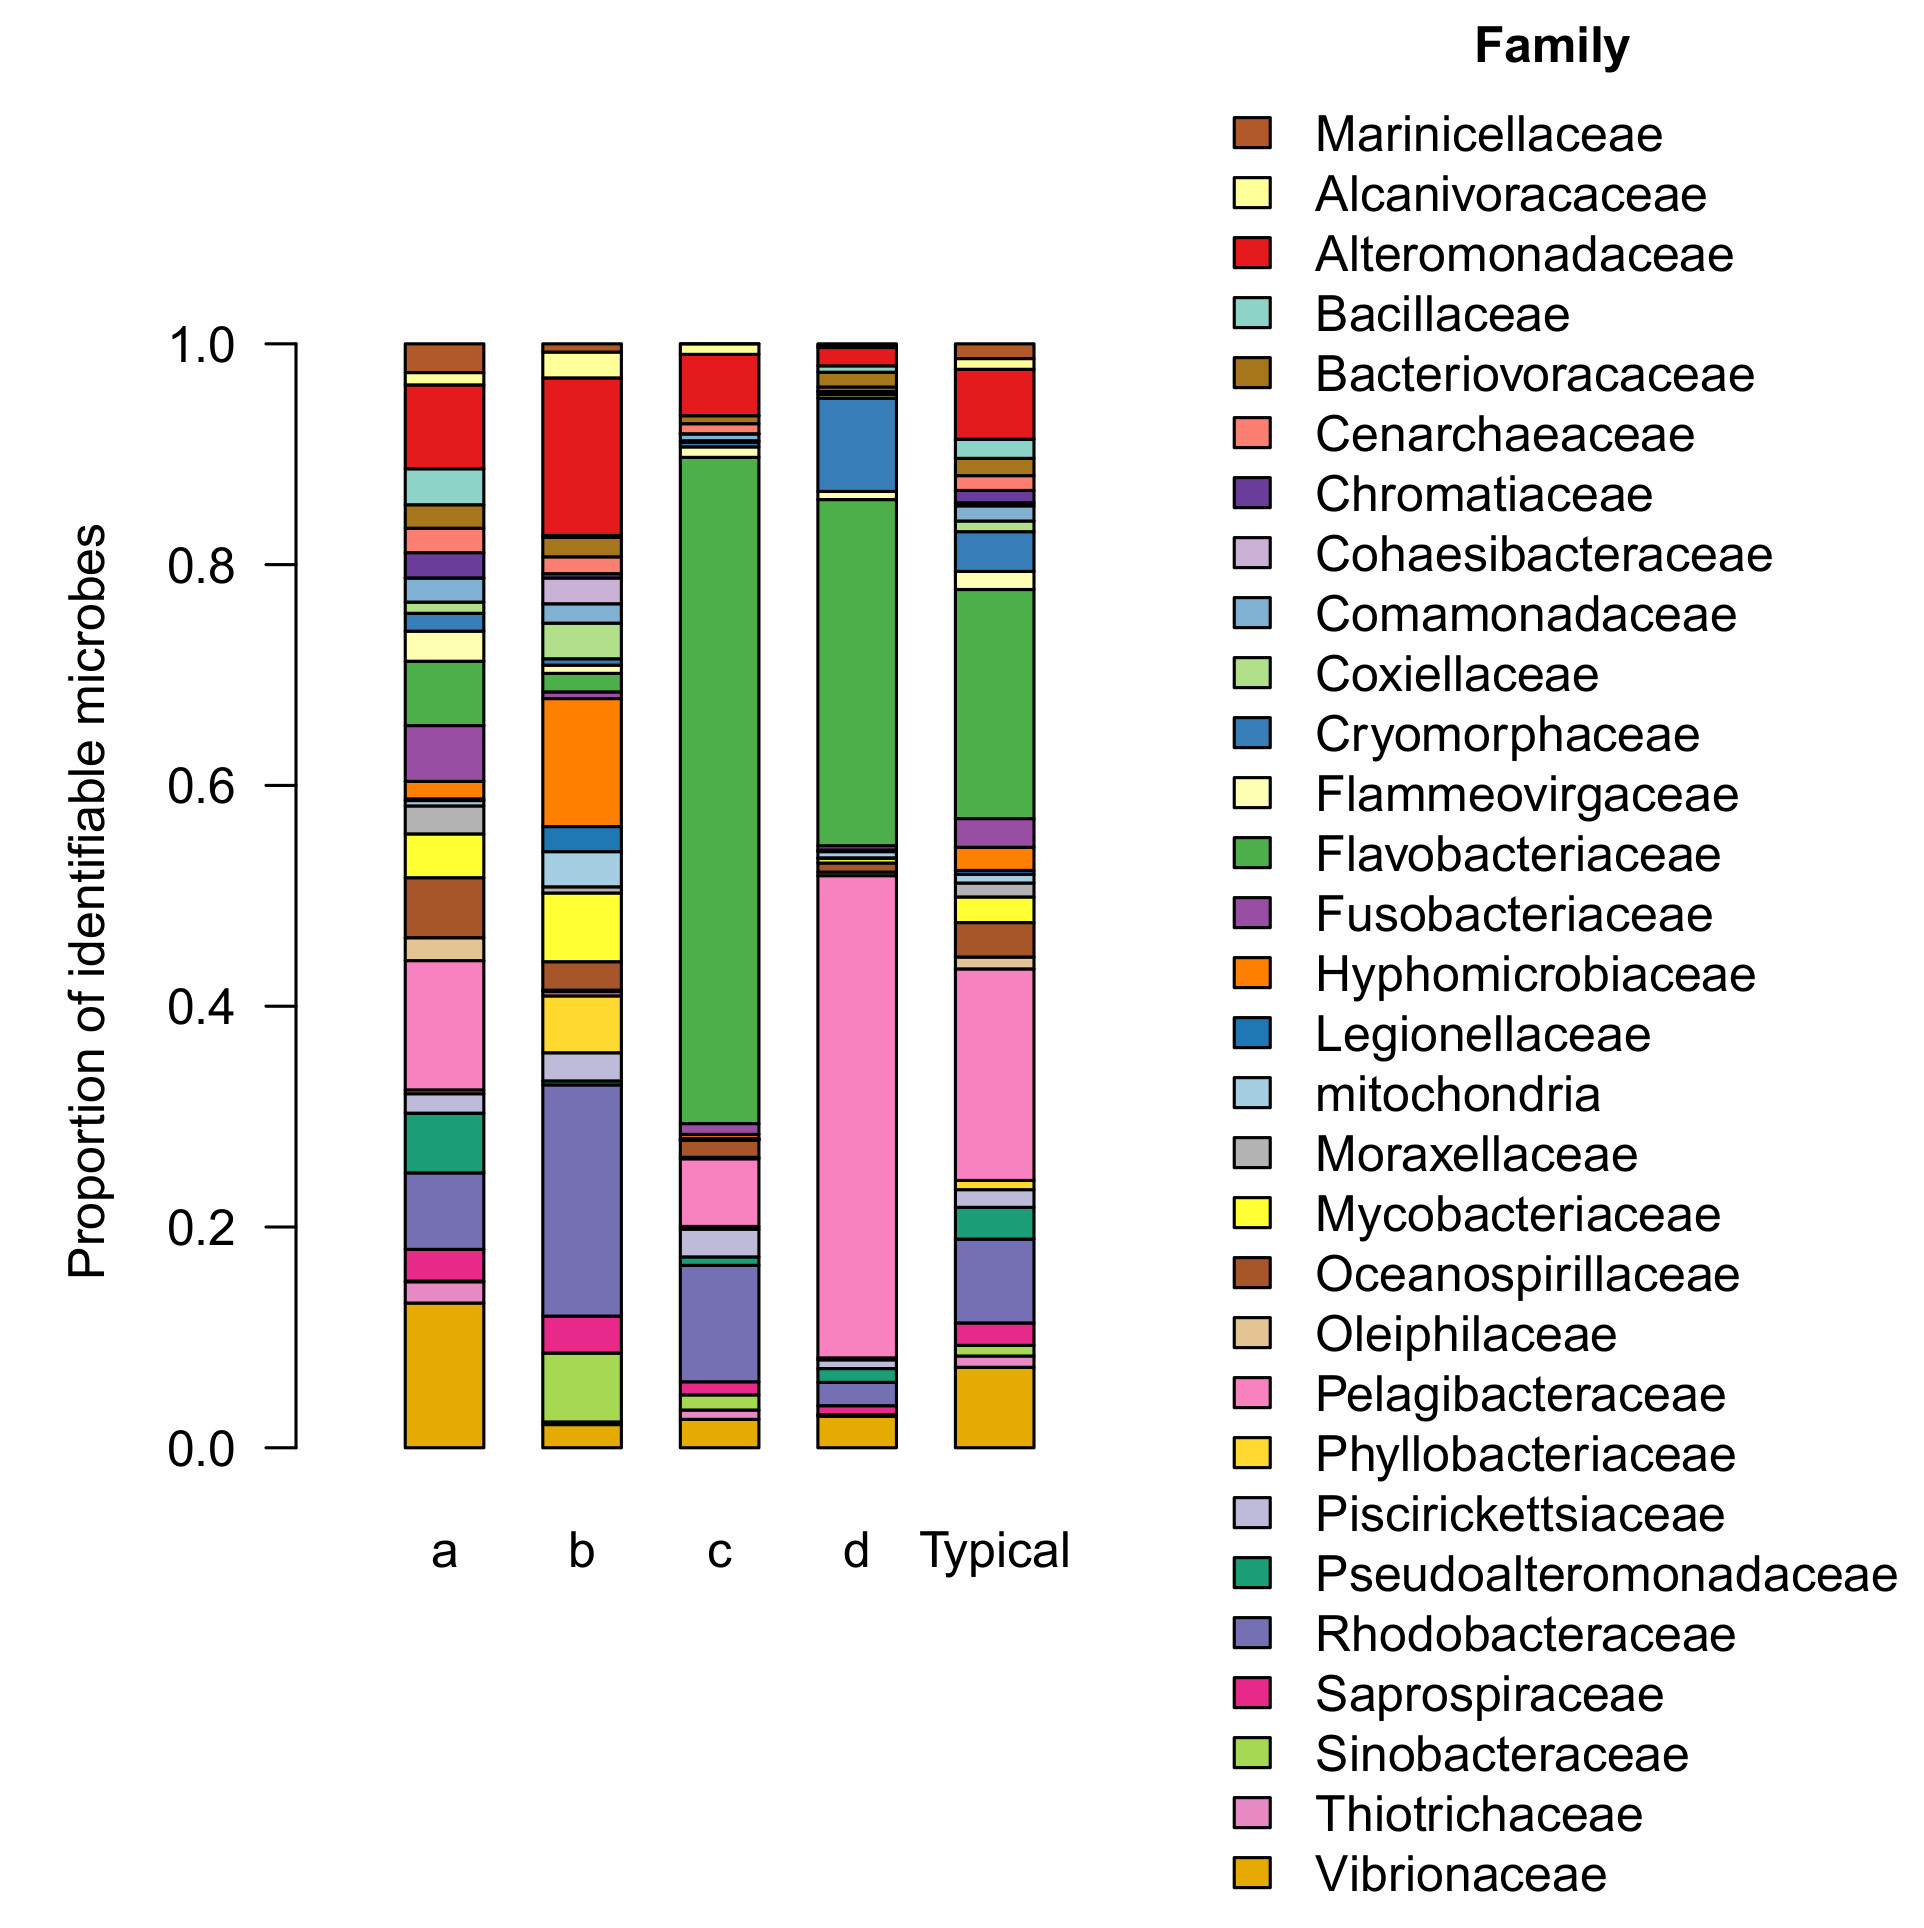
The microbial community in group a is generally similar to the core aquarium microbiome described in a previous article. All 19 families of the core aquarium microbiome can be readily identified in the group a microbiome (Figure 2).
Group a includes half of all aquariums we sampled, including tanks owned by the majority of participants (7 out of 11, or 64% of participants). The microbial community observed in this group occurs more frequently (50% of aquariums sampled) than any of the other patterns we observed (range: 10-25%). For these reasons, I interpret the composition and relative abundance of this microbial community as the consensus microbiome, and will refer to it as such in this report.
The microbial communities in group a were more diverse than the other groups. The average aquarium in group a contained 471 different microbial types, substantially higher than the diversity in any other group (range: 300-318).
The distribution of microbial families in group a was more even than other groups, which were dominated by a few highly abundant families (see below). For comparison, the top 3 most abundant families account for only 32% of the community in group (a), but account for 47-83% of the community in the other groups.
Beneficial microbes with known roles in nutrient processing were generally more abundant in the consensus microbiome than other groups. Ammonia-oxidizing microbes (both Bacteria and Archaea, AOB & AOA) made up 1.9% of the consensus microbiome, but were less abundant in other groups, contributing 0.2-0.3% on average.
Similarly, nitrite-oxidizing bacteria (NOB) were much more abundant in the consensus microbiome (0.2%) than in other groups (0-0.01%). (Since these nutrient processing microbes are much more abundant in biofilm than the water column, levels of zero should not be interpreted as absence in the whole aquarium, but rather as levels below the limit of detection in the water column).
The above description suggests the consensus microbiome is superior to outlier groups, but examining the levels of unwanted microbes presents a more nuanced perspective. Cyanobacteria were actually present at slightly elevated levels in the consensus microbiome (0.7% on average) compared with other groups (0.03-0.5%).
Bacterial fish pathogens were detected in several tanks, generally at low levels. These made up 0.17% of the consensus microbiome on average compared with 0-0.03% in other groups. (Although I also searched for known coral pathogens, I found no evidence of these in any tanks we sampled). This picture is further supported by a comparison of the core family Vibrionaceae (a family with many known pathogens), which was present at higher levels in group a (7% of the community) than any other group (range: 1-2% of the community; Figure 2).
Overall, this analysis shows that the consensus microbiome in group a is highly diverse, including all of the core microbial families at relatively even levels (compared with other groups). The consensus microbiome contains elevated levels of beneficial microbes compared with other groups. Interestingly, group a also contains elevated or similar levels of harmful or nuisance bacteria as the other groups. The presence of these microbes in the consensus microbiome of healthy reef tanks suggests that microbial problems in aquariums (e.g. disease or cyanobacterial blooms) are not simply driven by introduction of unwanted microbes, but are affected instead by interactions between these microbes and the rest of the microbial community.
Microbial communities in the other aquariums differed from the consensus microbiome in several ways. First, the abundance of several core families differed across groups. Second, some groups contained additional, unexpected families that were not found in the consensus microbiome. Finally, the outlier groups contained lower levels of both beneficial and harmful microbes than the consensus.
I’ll discuss these groups one by one, interpreting each group as a specific kind of deviation from the consensus microbiome.
Group b: profoundly different microbial communities
The microbial communities in group b diverged from the consensus more than any other group. Group b includes only 3 aquariums, but it’s interesting to note that each belonged to a different participant. This similarity (Figure 1, group b) suggests that the deviations from consensus observed in group b are not just random accidents in a single tank, but may result from some practice(s) employed by multiple aquarists.
Microbial communities in group b were substantially less diverse (318 types per tank, on average) than the consensus microbiome. The distribution of microbial families was comparable to the consensus in terms of evenness (Figure 2). About half of the community (47%) was contained in the top 3 most abundant families (Rhodobacteraceae, Alteromonadaceae, & Hyphomicrobiaceae), slightly more than in the consensus (32%). The composition was notably different, though. Neither Rhodobacteraceae nor Hyphomicrobiaceae was ranked among the top 3 most abundant families in the consensus microbiome (Vibrionaceae, Pelagibacteraceae, & Alteromonadaceae).
Many of the families of the core aquarium microbiome were absent or present at much lower levels in group b than in the consensus, including Flavobacteriaceae, Pelagibacteraceae, Vibrionaceae, Fusobacteriaceae, and Pseudoalteromonadaceae. Together these families account for 41% of the consensus microbiome but only 5% of the community in group b.
In their place, several core families were present at unusually high levels relative to the consensus. Together these families (Rhodobacteraceae, Alteromonadaceae, and Hyphomicrobiaceae) account for 47% of the community in group b, compared with only 16% of the consensus community.
The communities in this group also contained several additional families that were not part of the core microbiome. Together these families (Cohaesibacteraceae, Coxiellaceae, Legionellaceae, Phyllobacteriaceae, and Sinobacteraceae) made up 19% of the community in group b but were very rare in the consensus community, contributing only 2% altogether. Additional details about these families are shown in Table 1.
Table 1
Additional microbial families found in group b, that are not part of the core aquarium microbiome.| Family | Description | Metabolic capabilities | Ecological roles & responses | |
|---|---|---|---|---|
| 1 | Cohaesibacteraceae | Gram-negative, rod-shaped, motile Bacteria (Alphaproteobacteria) | Aerobic or facultatively anaerobic, chemoheterotrophic | Found in samples from coastal waters and mariculture ponds, but little is known about the ecology or physiology of this group. Capable of growth on a variety of carbon sources including sugars, amino acids, and other organic acids. |
| 2 | Legionellaceae | Gram-negative, rod-shaped, motile Bacteria (Gammaproteobacteria) | Aerobic, chemoheterotrophic | Widely distributed in aquatic environments, tolerant of high temperatures. Many are capable of infecting humans and leading to legionellosis. Specifically requires amino acids as a carbon source for growth. |
| 3 | Phyllobacteriaceae | Gram-negative; round or rod-shaped; Bacteria (Alphaproteobacteria). Some are motile. | Most aerobic & chemoheterotrophic | Found in soil and water sample, or associated with plants including nodules and rhizospheres. Plays important roles in nitrogen fixation for terrestrial plants. Some vitamin requirements for growth (e.g. biotin/B7). Capable of growth on a variety of carbon sources including sugars, amino acids, and other organic acids. Some capable of nitrate reduction. |
| 4 | Chromatiaceae | Gram-negative, varies widely in shape and motility (Gammaproteobacteria) | Some are anaerobic & photolithotrophic, relying on sulfide; others are aerobic & photoheterotrophic | Widely distributed in stagnant, well-lit, aquatic habitats, especially marine shorelines. Forms colored layers of biofilm in sediments in a variety of aquatic habitats. Many are dependant on vitamin B12 for growth. |
| 5 | Sinobacteraceae | Gram-negative, rod-shaped Bacteria (Gammaproteobacteria). Some are motile | Chemoheterotrophic, aerobic or facultatively anaerobic | Typically found in soil or freshwater, since most strains are sensitive to NaCl. A few can grow in marine conditions. These can grow on a wide range of sugars, amino acids, and other organic acids |
The microbial communities in group b contained lower levels of beneficial nutrient-processing microbes than the consensus microbiome. AOB & AOA made up only 0.28% of the community in this group, nearly 7 times lower than their abundance in the consensus community. NOB contributed only 0.01% to the group b community, 23-times lower than their contribution to the consensus community.
On the other hand, group b also contained lower levels of nuisance microbes and pathogens. Cyanobacteria made up only 0.03% of the group b microbiome, 20-times less than in the consensus. No pathogens of fish or corals were detected in any samples from group b.
Overall, the microbiomes in group b were profoundly different from the consensus in abundance, composition, and the levels of beneficial and harmful bacteria. The known differences in nutrient requirements and metabolic capacities of these microbial families suggests functional differences between group b communities and the consensus communities in group a. Specifically, most of the families enriched in group b (Table 1) are capable of growth on dissolved acids, and one (Legionellaceae) requires amino acids for growth. Two of these families (Phyllobacteriaceae & Chromatiaceae) require B-vitamins (B7 and B12 respectively) for growth. Together, these observations suggest that the different microbial communities in group b may be driven by differences in nutrient profiles. However, since the notes about these tanks recorded by the owners did not reveal any consistent practices that would explain this (e.g. dosing of amino acids), the cause of these differences remains unknown.
Groups c & d: communities dominated by a few families
Both of the remaining outlier groups (c & d, Figure 1) differed from the consensus in a similar way – both were dominated by a pair of families (Flavobacteriaceae & Pelagibacteraceae) that were already abundant in the consensus microbiome (together, accounting for 17.5% of the community), but even more so in groups c and d (66% and 75% of these communities respectively). Notably, the ratio between these two families differed substantially between groups, with group c dominated by Flavobacteria while the two families were present at comparable levels in group d (Figure 2).
Both groups were less diverse than the consensus microbiome, with 308 and 337 microbial types on average respectively.
In both groups, the increased relative abundance of Flavobacteriaceae & Pelagibacteraceae is accompanied by corresponding reductions in the relative abundance of other core families. The simplest interpretation of this pattern is that Flavobacteriaceae & Pelagibacteraceae are truly present at higher levels, pushing the relative abundance of all other families lower without any real changes in their absolute abundances.
In this context, it’s interesting to note that a few families resisted this trend and were actually present at higher levels in groups c or d than in the consensus. These families are the main difference between groups c and d, which are otherwise very similar. Rhodobacteraceae was slightly more abundant in group c (10% of the community) than in the consensus (7%). Cryomorphaceae was much more abundant in group d (8.4% of the community) than in the consensus (1.6%).
Groups c and d were similar in their content of nutrient-processing microbes, which were less abundant in both groups than in the consensus. AOA & AOB were about 9-times less abundant in these groups (0.2% and 0.3% in c and d respectively) than in the consensus microbiome (1.9% of the community). NOB were much less abundant in these groups; none were detected in group c, and the levels in group d (0.005%) were 40-times lower than the consensus (0.2%). As discussed above, the increased abundance of Flavobacteriaceae & Pelagibacteraceae relative to all other families decreases the relative abundance of other families, which may account for the differences described here without any real decrease in nutrient processing communities.
Cyanobacteria were much less abundant in group c (0.03% of the community) than in the consensus microbiome (0.7%). In contrast, group d showed similar levels of cyanobacteria as the consensus (0.5%). Both groups showed lower levels of fish pathogens (0% and 0.02%) than the consensus (0.17%), which could similarly be explained entirely by the elevated levels of Flavobacteriaceae & Pelagibacteraceae in these groups.
What could cause these differences?
Deviations from the consensus microbiome can be largely understood as excesses in or more of six microbial families (Flavobacteriaceae, Pelagibacteraceae, Rhodobacteraceae, Hyphomicrobiaceae, Alteromonadaceae, and Cryomorphaceae).
These families together make up a large fraction of the microbiome in most samples, and variation in their relative levels explains a majority of the variation among microbiomes. Based on these observations, we can conclude that the factors driving variation in these families’ growth are likely to be important for driving the overall community structure.
All six families are primarily or exclusively aerobic chemoheterotrophs. In other words, they require oxygen and get their metabolic energy by oxidizing organic compounds from the environment. The abundance of microbes with this lifestyle is typically determined by the availability of the specific nutrients each is capable of processing. These six families differ in their nutritional requirements, including requirements for specific compounds such as methylated amines (MA), reduced sulfur compounds (e.g. DMSP), and specific amino acids (e.g. glycine). (read more here)
The specificity of these requirements suggests the hypothesis that variation in unmeasured dissolved nutrients drives the majority of variation in aquarium microbiomes. Specifically, reduced sulfur compounds (e.g. DMSP), carbon sources (e.g. polysaccharides and simple sugars), and nitrogen sources including methylamines, proteins, and amino acids are important for the growth of these groups. Few if any aquarists measure or deliberately dose these individual compounds, although many are present in commonly used foods. DMSP is a natural algal metabolite, and amino acids are present in all protein-containing foods. The existing variation probably results from variation in the addition of these compounds in food or production through natural biological processes in each aquarium (e.g, DMSP production by algae).
Now that microbiome testing is readily available for aquariums, it will be interesting to learn how deliberate manipulation of the nutrient profiles in aquariums can be used to adjust their microbiomes.
Summary
This comparison of microbial communities in saltwater aquariums revealed that while there is a consensus community found in half of the aquariums we tested, not every tank is the same. Interestingly, the deviations from the consensus that we saw in this survey fell into a few clear patterns. Some tanks (group b) harbored communities that were comparable to the consensus in diversity and evenness, but were composed of different, unexpected microbial families. The microbial communities in other tanks (groups c & d) included primarily the same families as the consensus community, but these were much less even than the consensus, with a few families dominating each community.
If every aquarium had an identical microbial community, there would be no use in measuring these communities in different tanks. On the other hand, if each community was completely different without any similarities, it would be very difficult to study the causes of this variation, or its effects on aquarium conditions.
In fact, we find that most tanks share a core set of families at similar levels, while a few tanks deviate from this consensus in systematic ways. This pattern suggests that these communities have been affected by systematic differences in the setup or maintenance of these aquariums.
As we continue to gather data from additional tanks, I hope to identify the factors that drive these communities in one direction or another, so that aquarists can not only test their aquarium’s microbiome but also adjust it.
Stay tuned!
-Eli Meyer, AquaBiomics